

Bernardo Belchior builds the next generation of React charts at MUI. He focuses on performance tuning and data visualization, building tools that developers use to render charts, maps, and interactive graphics on the web.
His work regularly tests the boundaries of browser rendering limits. He explores how to make SVGs fast, tackling problems like rendering scatter charts with over 10,000 data points. By finding hidden bottlenecks and building new performance measurement techniques, he actively improves how charting libraries handle massive datasets.
Videos
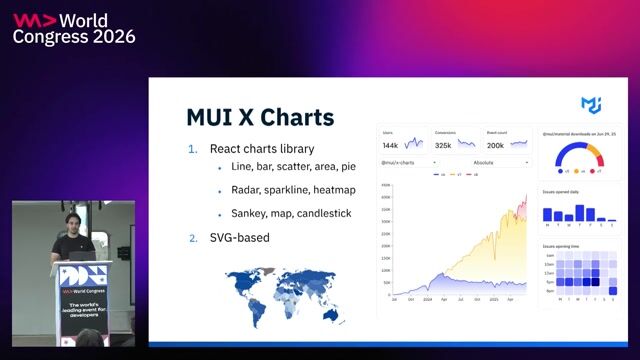
Can SVG be fast? Rendering a scatter chart with over 10k points

Bernardo Belchior · MUI
World Congress Europe · 2026