



CH
Chris Heilmann
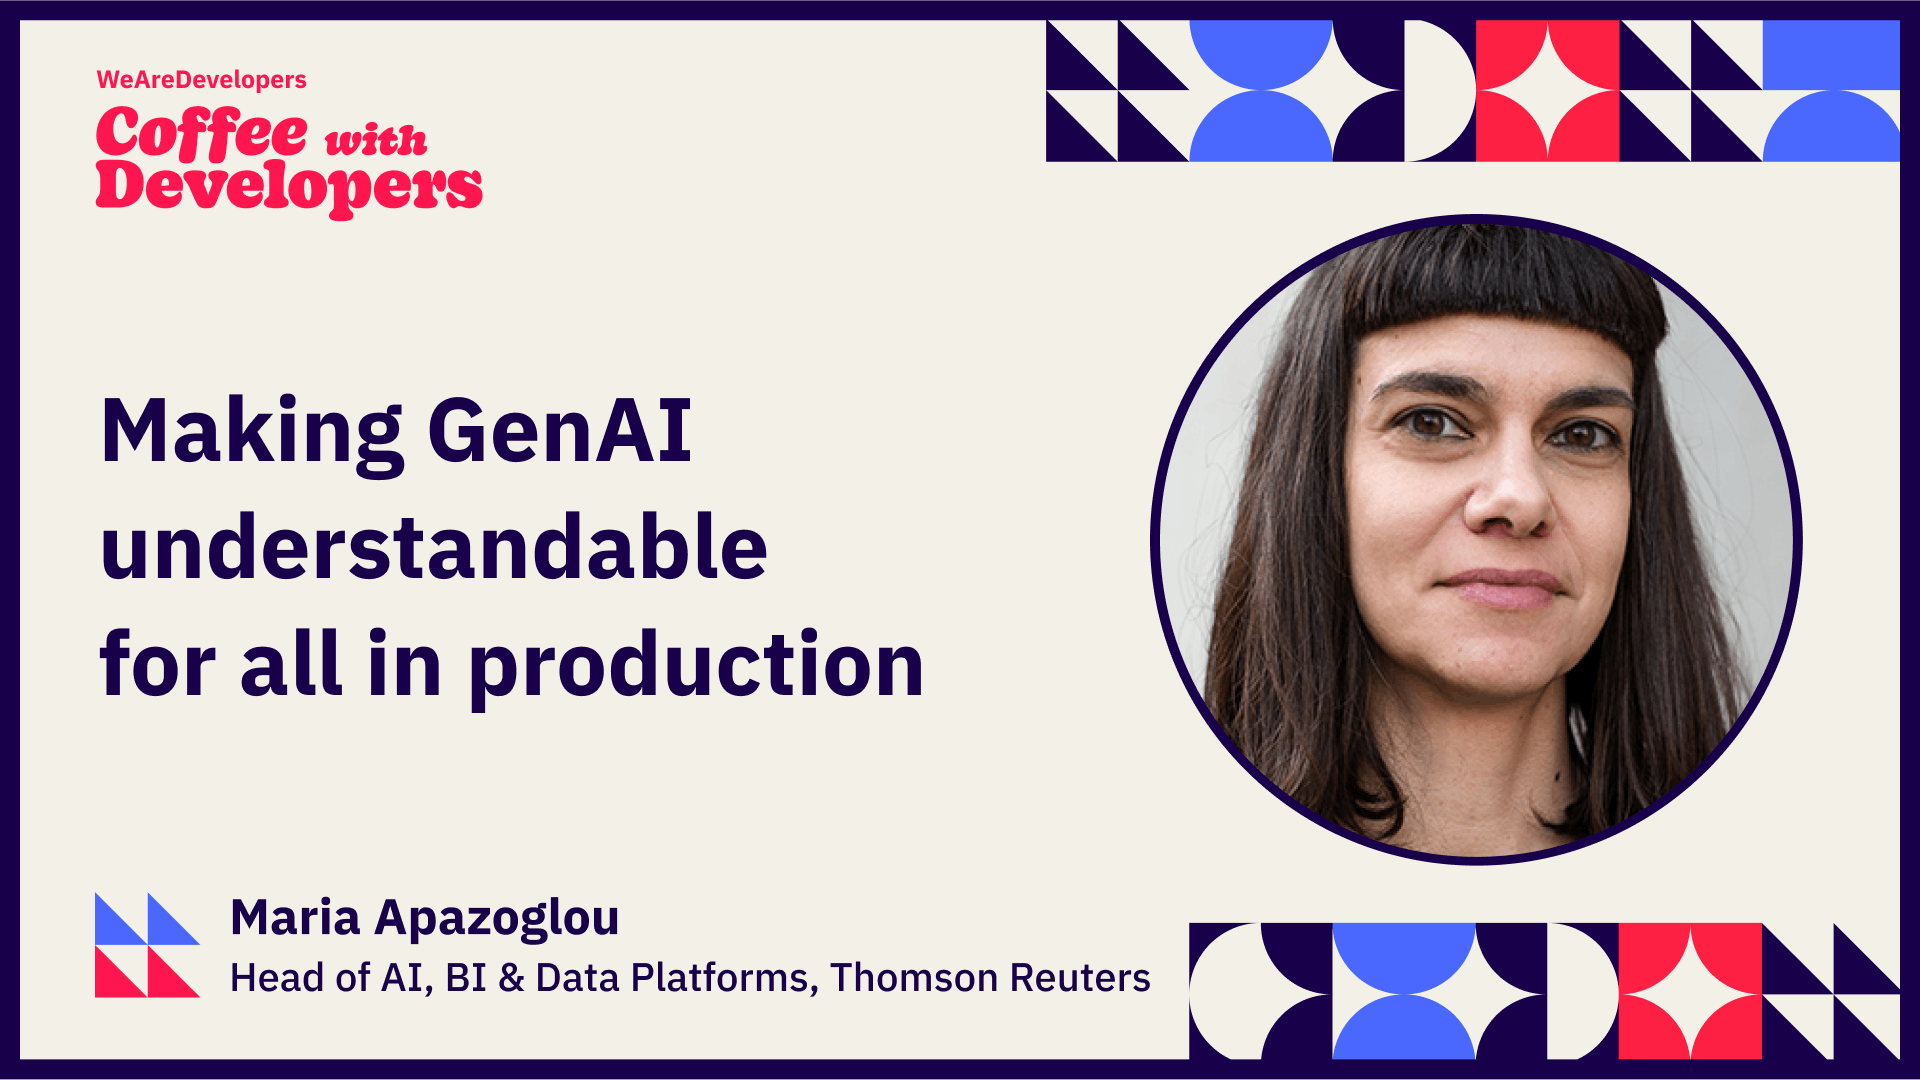
Coffee with Developers - Maria Apazoglou - Making AI understandable for all in production
almost 2 years ago
About the projectImpressit is looking for a Principal Visualization Engineer/Data Analyst to join a strategic Data &Analytics team.This role focuses on shaping enterprise-level visualization and analytics strategy, building scalable BI solutions, and partnering with trading, risk, and operations leadership to transform complex business needs into actionable data products.This is a high-impact position working with large energy trading datasets, advanced analytics platforms, and executive stakeholders.Important: Must be located in Spain / Portugal.What you will doLead enterprise-level development of BI products and visualization strategyDefine and implement reusable visualization patterns and federated dataset strategiesTranslate ambiguous business requirements into clear analytics roadmaps and scalable data productsPartner with trading, risk, and operations leadership to deliver decision-driving insightsFacilitate story-driven analytics reviews and executive presentationsEstablish standards for visualization design, quality, and governanceLead analytics design councils and community of practice initiativesPromote adoption of certified datasets and reusable analytics assetsChampion data governance, developer enablement, and analytics best practicesInfluence analytics platform and investment decisions across the organizationWhat we expect12+ years of commercial experience in Data Analytics, Business Intelligence, or Data VisualizationExpert-level experience with Power BI, including Advanced DAX, Power Query, semantic modeling, security configuration, and deployment in Power BI ServiceStrong expertise in SQL, including query optimization, diagnostics, and performance tuning across large datasetsSolid experience with dimensional data modeling (star/snowflake schemas, conformed dimensions, calculation groups)Deep understanding of data visualization and information design, including accessibility, storytelling, and interaction patternsExperience designing reusable datasets and scalable BI architectures for enterprise environmentsHands-on experience with governance and BI DevOps practices, including workspace strategy, dataset certification, version control (Git), and CI/CD pipelinesStrong understanding of Agile methodologies and cross-functional collaborationProven ability to lead analytics initiatives across multiple teams or business domainsExcellent communication skills and ability to influence senior and executive stakeholdersAs a plusExperience working in energy trading, commodities, or financial trading environmentsKnowledge of trading concepts, including P&L drivers, exposure, positions, and risk metricsExperience with Azure data platforms, such as Databricks, Azure Data Factory, or Microsoft FabricFamiliarity with data cataloging and dataset reuse strategiesExperience using Python for data preparation or analysisReady to join the team?Employee benefitsWe are passionate about everything we do, and with Impressit you will get:Professional education and training budget#J-*****-Ljbffr
12+ years of commercial experience in Data Analytics, Business Intelligence, or Data Visualization Expert-level experience with Power BI, including Advanced DAX, Power Query, semantic modeling, security configuration, and deployment in Power BI Service Strong expertise in SQL, including query optimization, diagnostics, and performance tuning across large datasets Solid experience with dimensional data modeling (star/snowflake schemas, conformed dimensions, calculation groups) Deep understanding of data visualization and information design, including accessibility, storytelling, and interaction patterns Experience designing reusable datasets and scalable BI architectures for enterprise environments Hands-on experience with governance and BI DevOps practices, including workspace strategy, dataset certification, version control (Git), and CI/CD pipelines Strong understanding of Agile methodologies and cross-functional collaboration Proven ability to lead analytics initiatives across multiple teams or business domains Excellent communication skills and ability to influence senior and executive stakeholders As a plus Experience working in energy trading, commodities, or financial trading environments Knowledge of trading concepts, including P&L drivers, exposure, positions, and risk metrics Experience with Azure data platforms, such as Databricks, Azure Data Factory, or Microsoft Fabric Familiarity with data cataloging and dataset reuse strategies Experience using Python for data preparation or analysis Ready to join the team?
This job is hosted externally. Click below to view the full posting and apply.
Apply on www.buscojobs.com.esTalks and stories from around this role — technically off-topic, practically not.
6:21 min
2:17 min
 Dominik Krichbaum · WWC Europe 2026
3:28 min
3:03 min
56 sec
 Eileen Uchitelle +1 · Coffee With Developers
1:34 min

.gif)


.webp)