




Data Visualization Specialist Role
- Discuss this with your agent
- Open in Claude
- Open in ChatGPT
Prepare application
- Draft this with your agent
- Open in Claude
- Open in ChatGPT
Role details
Tech stack
Job description
The work sits where data, design, accessibility, and front-end behavior meet. Specialists choose appropriate visual forms, create hierarchy and interaction, test comprehension, optimize performance, and provide equivalent access through text, tables, labels, keyboard behavior, and assistive technology. Federal-facing openings may require Section 508 conformance, while other openings may use Web Content Accessibility Guidelines (WCAG) or comparable standards. What you may build
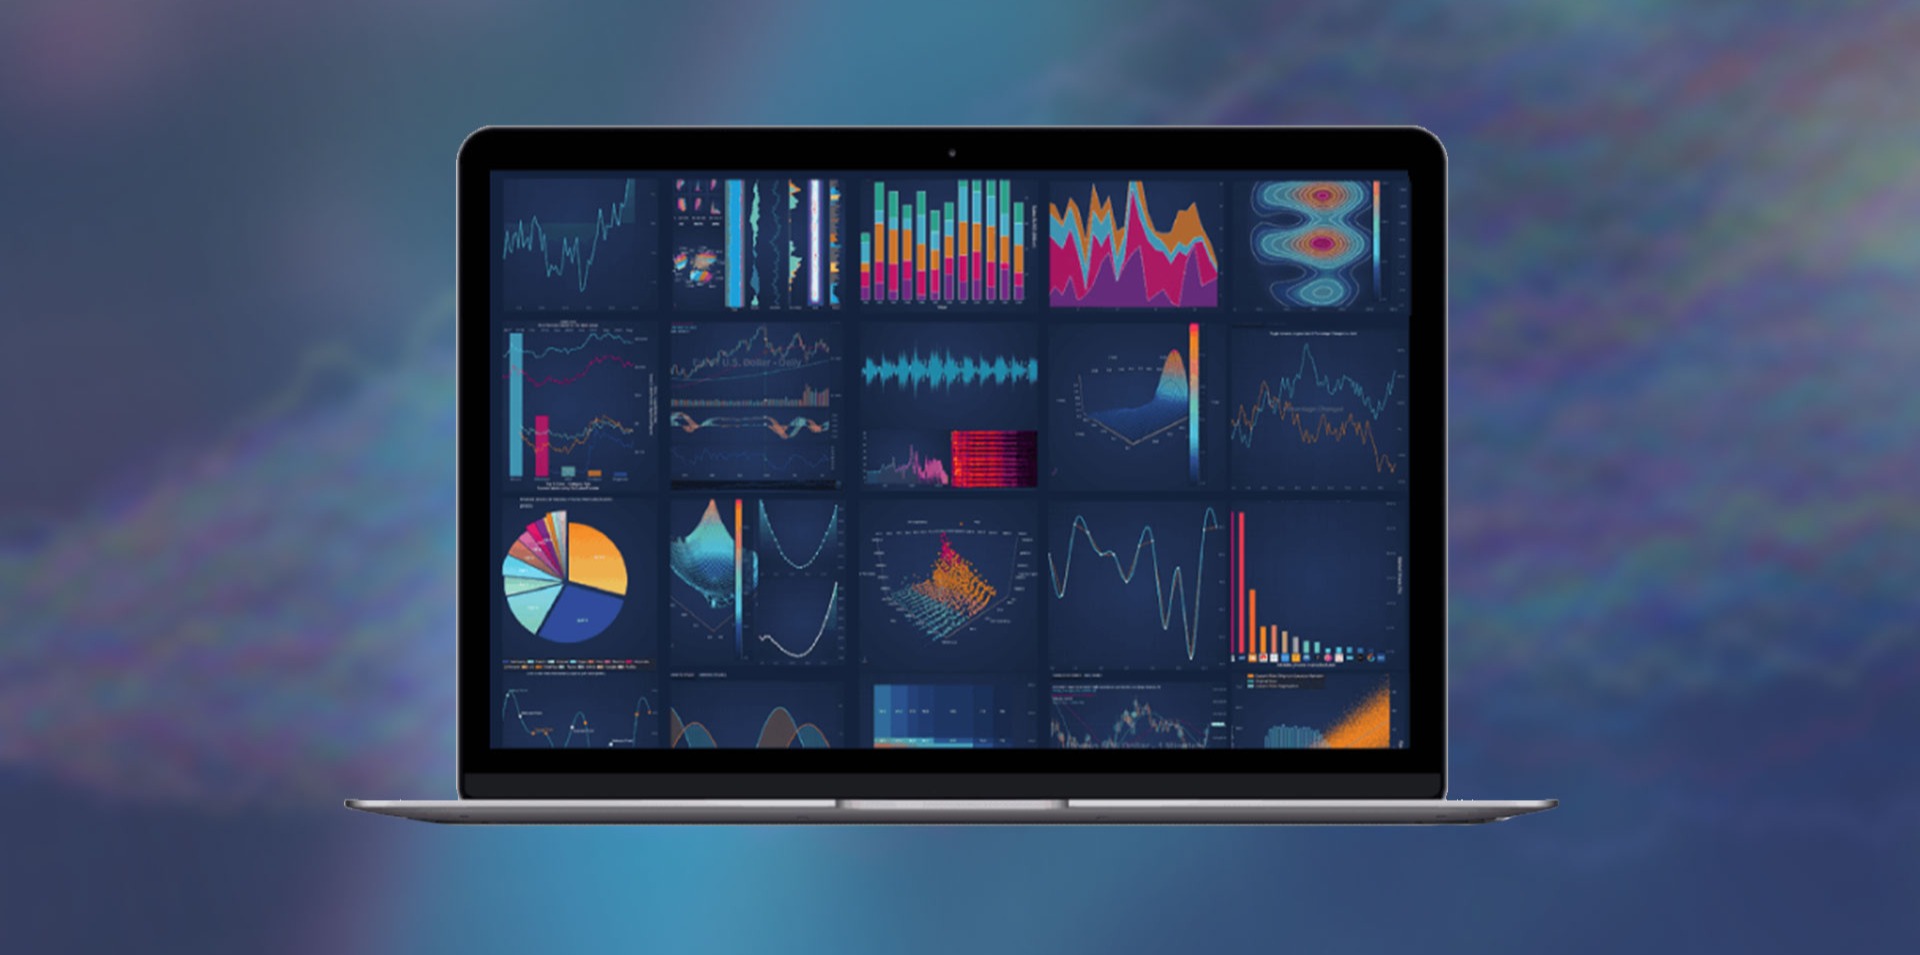
- Interactive dashboards and exploratory tools that help users compare measures, filter views, inspect details, and understand context.
- Charts, maps, diagrams, infographics, and published statistical graphics with accurate scales, labels, units, sources, and uncertainty cues.
- Reusable visualization components, style rules, templates, and design-system patterns that make visual products consistent and maintainable.
- Accessible alternatives and enhancements, including plain-language summaries, data tables, meaningful descriptions, keyboard interaction, sufficient contrast, and non-color cues.
- Performance-tested, responsive visual experiences built with business-intelligence platforms, web technologies, or visualization libraries and validated with users and subject-matter experts.
Who you are
You are fluent in both data and design. You know how chart form, scale, annotation, color, motion, and interaction change interpretation, and you remove visual complexity that does not help the audience.
You care whether every user can reach the information, not only whether the graphic looks polished. You work closely with analysts, researchers, engineers, designers, accessibility specialists, and communicators to protect meaning from source data through publication. What you bring
Requirements
- A strong foundation in visual encoding, chart and map selection, hierarchy, typography, color, annotation, interaction, and data storytelling.
- Ability to inspect, reshape, validate, and reason about the data behind a visual product rather than treating the final dataset as unquestioned.
- Experience with BI platforms, web visualization, design tools, or code-based charting, supported by a portfolio that shows your decisions and their results.
- Working knowledge of accessibility requirements and practices for charts, dashboards, maps, keyboard interaction, screen readers, text alternatives, contrast, and non-color cues.
- The judgment to represent uncertainty and limitations honestly, test comprehension with users, and balance clarity, performance, maintainability, and visual consistency.
Apply for this position
This job is hosted externally. Click below to view the full posting and apply.
Prepare application
- Draft this with your agent
- Open in Claude
- Open in ChatGPT
Good distractions
Talks and stories from around this role — technically off-topic, practically not.
Moments
Explore playlistsVideos
See allRelated articles
See all
Dev Digest 119 - ❤️ === ❤️
Dev Digest 139 - Soft and hard queries
The Fastest JavaScript Charts - Built for React and Beyond
Dev Digest 129 - Now that's what I call private data!