

EM
Eli McGarvie
Data Analyst Salary in the UK
about 3 years ago
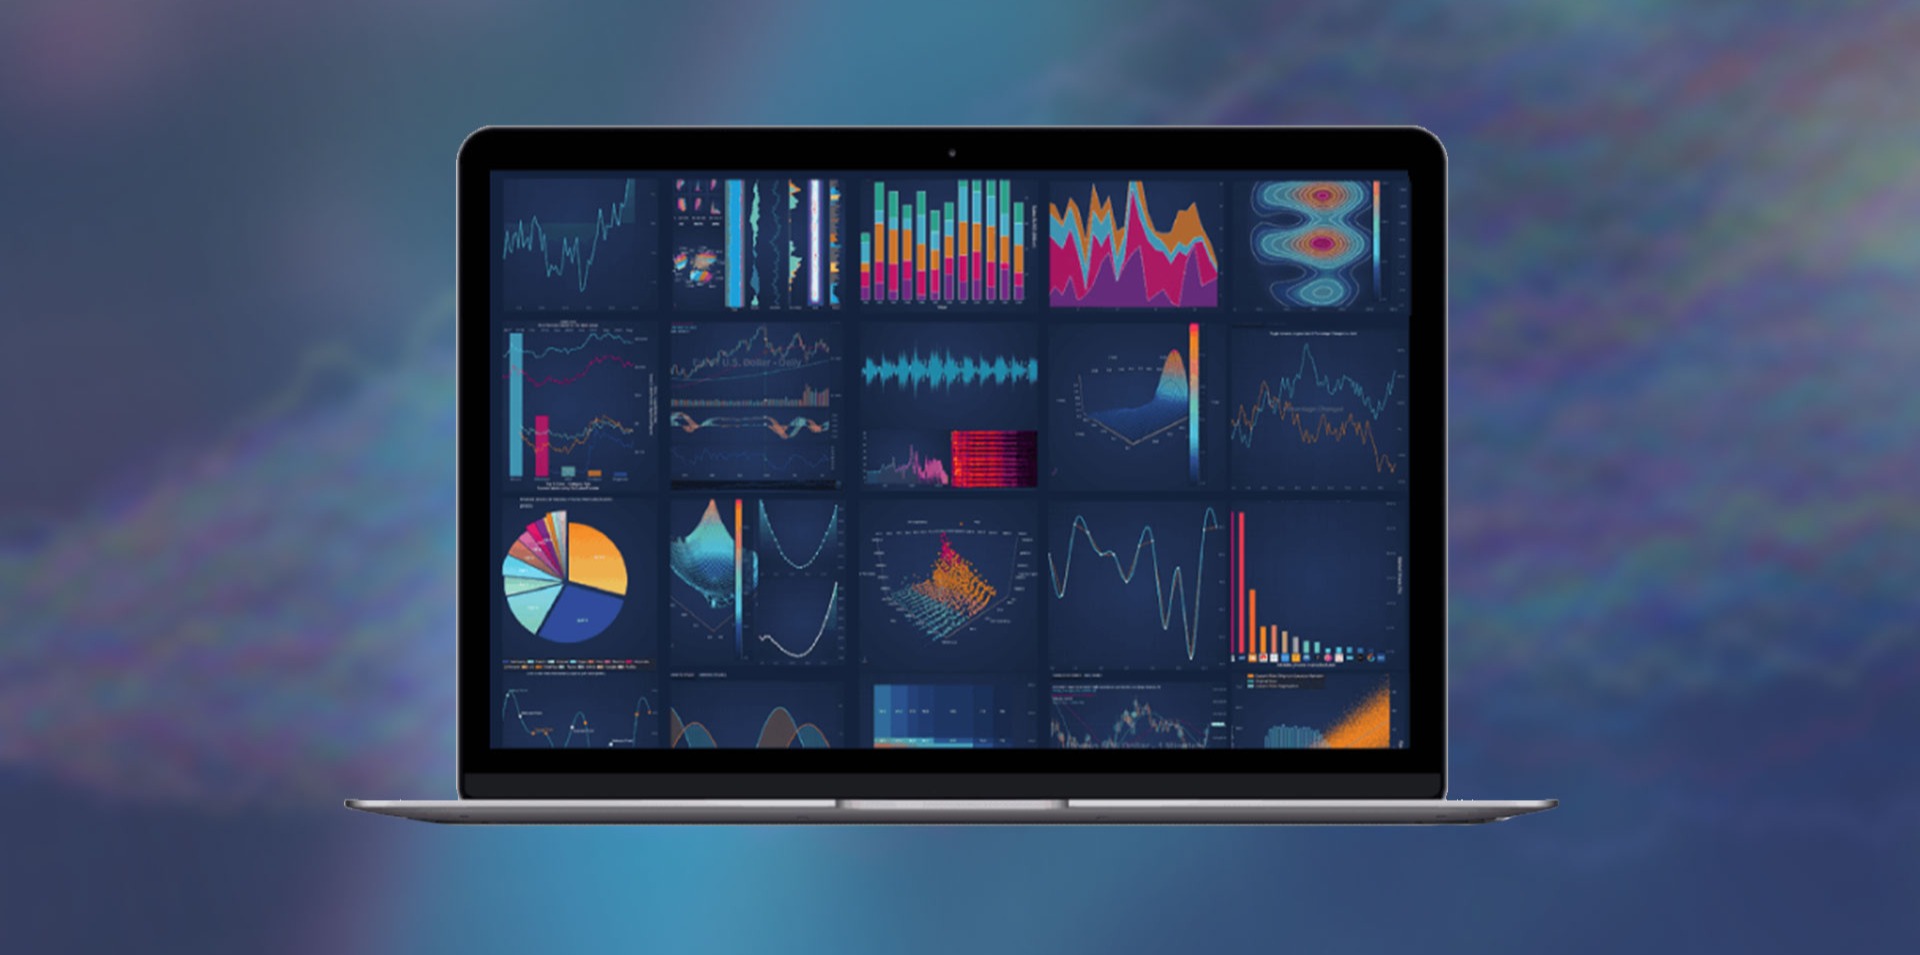
What if the data you worked with didn’t just populate dashboards but helped leaders make better decisions about people, performance, and readiness? At Horizon Performance, we believe data becomes valuable when people can understand it, trust it, and act on it. We work with organizations that operate in demanding environments where leaders need more than reports-they need clear, timely, and actionable insight., We are looking for a Data Visualization Specialist who can turn complex data into meaningful information while also helping implement, support, and continuously improve the systems that make those insights possible. This is not simply a dashboard-development position. You will work directly with users and stakeholders to understand what they need to know, analyze complex datasets, develop interactive visualizations, support software implementation and testing, troubleshoot technical issues, train users, and help ensure data-driven solutions are successfully adopted and sustained. This full-time position supports the Whole Marine Program (WMP) at the Marine Raider Training Center (MRTC) and is located at Camp Lejeune, North Carolina., You will design, develop, and deploy interactive reports, dashboards, and other visualizations using Power BI and, where appropriate, tools such as Tableau or D3.js. You will apply sound visualization principles to ensure information is clear, concise, accessible, and appropriate for the intended audience. These responsibilities directly reflect the SOW’s required design, development, and visualization functions. Success means stakeholders don’t just receive more data-they can quickly understand performance, identify what requires attention, and use the information to make informed decisions.
· Tell the Story Behind the Data
You will go beyond presenting charts and metrics. You will use data visualization and analysis to explain what is happening, identify meaningful patterns, communicate why those patterns matter, and help stakeholders understand the implications. Success means complex analysis becomes a compelling and understandable story that helps people move from information to action.
· Partner with Stakeholders to Solve the Right Problems
You will work directly with stakeholders to understand their operational needs, reporting requirements, questions, and priorities. You will translate those needs into practical analytical and visualization solutions and continuously refine those solutions based on user feedback. Success means the products you build answer meaningful questions, meet stakeholder expectations, and improve how users understand and apply information.
· Enable Users and Drive Adoption
You will help users understand and effectively use the tools and information available to them. This includes delivering training, demonstrations, and user enablement while translating technical or analytical concepts into language appropriate for different audiences. Success means users understand the tools, trust the information, and can independently use the system and its visualizations to support their work.
· Drive Data Quality, Governance, and Continuous Improvement
You will apply strong data-modeling and data-governance practices while continually looking for ways to improve analytics, visualizations, processes, and the overall user experience. The Government specifically requires Power BI experience encompassing report/dashboard development, data modeling, and data governance. Success means data and visual products remain accurate, understandable, useful, and sustainable as requirements evolve.
· Collaborate and Contribute to the Team
You will work as part of a cross-functional Horizon team that includes technical, product, consulting, analytics, and client-facing professionals. You will be expected to communicate clearly, solve problems collaboratively, manage competing priorities, and take ownership of outcomes. Success means the entire team performs better because you are part of it.
Skills Needed to Win
· Bachelor’s degree in data science, business analytics, graphic design, or a related field
· At least 3 years of experience in data analysis, business intelligence, and data visualization
· Demonstrated experience with Power BI, including report and dashboard development, data modeling, and data governance
· Strong understanding of data analysis, business intelligence, and data visualization principles and concepts
· Demonstrated ability to analyze complex data and identify meaningful insights, patterns, and trends
· Strong analytical and problem-solving skills
· Excellent communication and collaboration skills with the ability to work effectively with stakeholders
· Ability to translate complex data and analytical concepts into clear, understandable visual narratives
· Ability to operate effectively in a fast-paced environment while managing multiple priorities and deadlines
· Ability to work independently while also contributing effectively as part of a cross-functional team
· U.S. citizen with the ability to obtain and maintain a U.S. Government security clearance
Preferences
· Experience developing interactive dashboards and reports for operational or executive decision-making
· Experience with Tableau, D3.js, or other data visualization platforms
· Experience with data modeling, data governance, and business intelligence environments
· Experience supporting end-to-end software implementations
· Experience conducting functional testing, field testing, user acceptance testing, or software validation
· Experience troubleshooting software or data-related issues in operational environments
· Experience developing and delivering user training or supporting technology adoption
· Experience working with performance-management, training, talent-development, or human-performance data
· Experience working with military, Department of Defense, government, or other high-performance organizations
Work Environment
This position is based at Camp Lejeune, North Carolina. The individual must be able to work eight-hour days under normal working conditions and up to 12.5 hours per day when deployed to an off-site location.
· U.S. citizen with the ability to obtain and maintain a U.S. Government security clearance, * Bachelor’s (Required), * Data Analyzation and Visualization: 3 years (Required)
Pulled from the full job description
· Medical, Dental, and Vision Insurance & Health Savings Account (HSA) options
· Long-Term Disability Coverage
· Accident Protection Insurance
· 401(k) Retirement Plan
· Professional development and certification opportunities
· Opportunities for career growth within Horizon Performance
· Clothing Stipend
This job is hosted externally. Click below to view the full posting and apply.
Talks and stories from around this role — technically off-topic, practically not.
4:00 min
1:48 min
1:24 min
 Piotr Menclewicz · Europe 2026 Virtual
3:09 min
3:15 min
6:07 min

.gif)