
How Redback Racing Uses SciChart for Real-Time Motorsport Telemetry
- Discuss this with your agent
- Open in Claude
- Open in ChatGPT
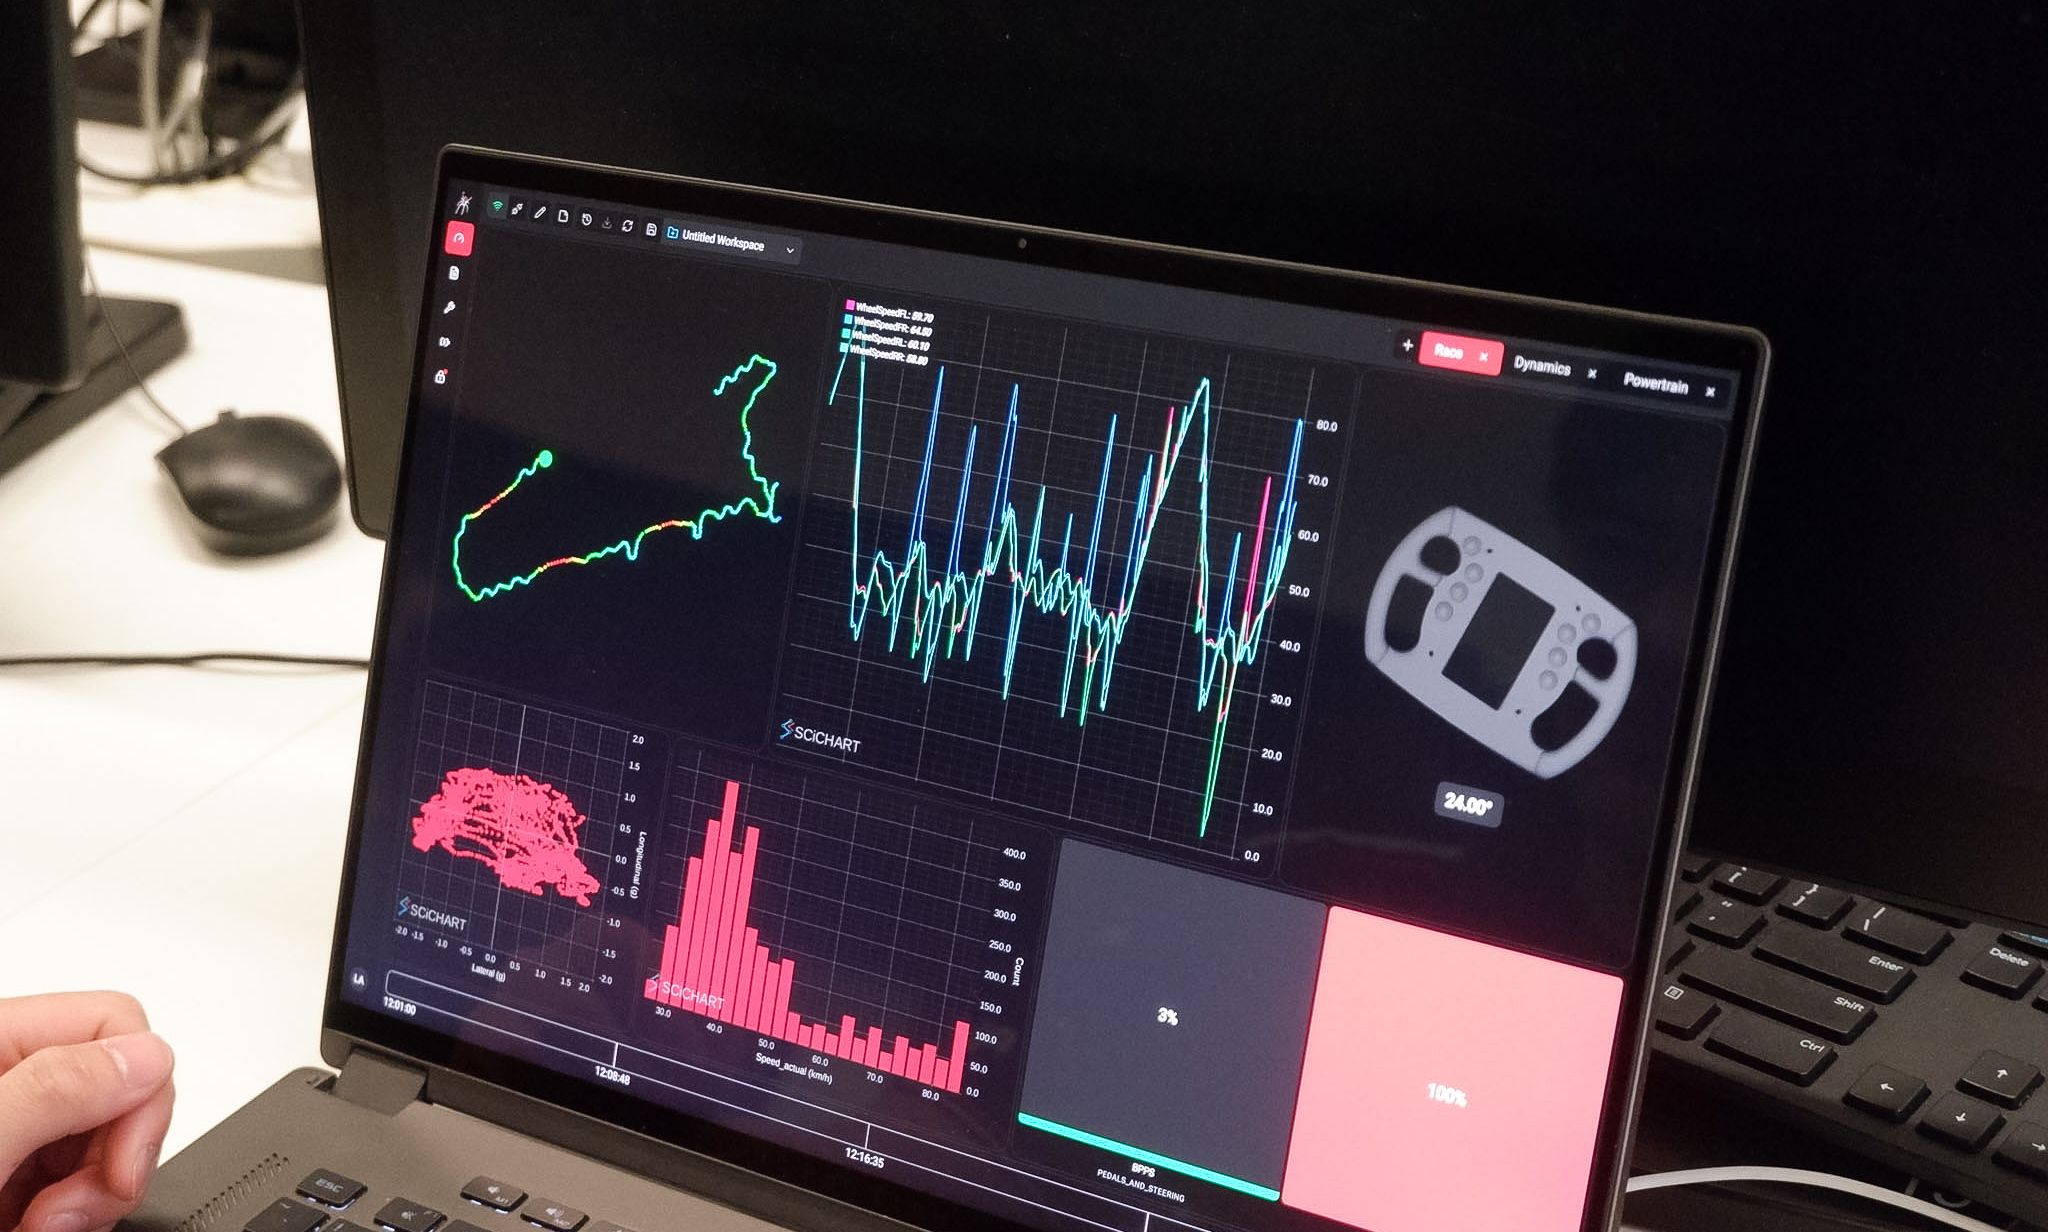
How do Formula Student teams analyse large volumes of live vehicle telemetry without slowing down their engineering workflow?
For UNSW Redback Racing, the answer was to rebuild its telemetry visualisation around SciChart.
Redback Racing is the University of New South Wales’ Formula Student team, developing and racing an all-electric Formula-style car. During testing, engineers need to monitor large volumes of vehicle data in real time — from battery temperatures to powertrain performance — and then analyse that same data after each run.
What problem was Redback Racing trying to solve?
The team had built its own telemetry platform, Spyder, for monitoring and analysing vehicle data.
As datasets grew larger and more complex, its original charting implementation started to become a limitation.
To maintain acceptable performance, Redback Racing was using separate charting implementations for:
- Live telemetry during vehicle testing
- Historical telemetry analysis after a run
That meant more code, more maintenance and greater complexity for the engineering team.
Why did Redback Racing choose SciChart?
Redback Racing integrated SciChart into its React-based telemetry platform to improve performance when visualising large and rapidly updating datasets.
SciChart allowed the team to support both real-time and historical telemetry using a single charting component.
Engineers gained:
- Fast real-time chart updates
- Smooth zooming and panning across dense datasets
- High-performance visualisation of long-duration telemetry
- A unified solution for live and historical data analysis
This simplified the architecture of Spyder while improving the experience for engineers using the system trackside.
How does live telemetry replay work?
One of the most useful capabilities Redback Racing developed was live replay.
While a test session is still running, engineers can move backwards through the telemetry data to investigate something that has just happened.
New telemetry continues streaming in the background.
Once the engineer has finished investigating the event, they can immediately return to the current live data.
For motorsport engineering, this is particularly useful because unexpected behaviour can be investigated during the test session rather than waiting until the run has finished.
What changed after implementing SciChart?
The biggest change was that chart rendering was no longer the performance bottleneck.
Instead, the limiting factors moved further back into the telemetry pipeline, including the team's streaming architecture and hardware.
For Redback Racing, that meant the engineering team could spend less time maintaining charting infrastructure and more time analysing the vehicle.
The telemetry platform also became more reliable during test days, when engineers need data visualisation to work consistently and without interruption.
Why does high-performance charting matter in motorsport?
Modern race vehicles generate large amounts of telemetry.
Engineers need to analyse that data quickly to understand vehicle behaviour, identify problems and make setup decisions.
When charting software cannot keep up with the incoming data, engineers either have to reduce the amount of information displayed or build increasingly complex workarounds.
Redback Racing's implementation shows another approach: using a high-performance charting engine capable of supporting real-time telemetry, historical analysis and live replay within the same application.
The result is a simpler telemetry architecture — and more time for engineers to focus on improving the car.
Read the full Redback Racing case study to see how SciChart is used inside the Spyder telemetry platform.