
Which React Chart Library Should You Use? It Depends on Your Data Size
- Discuss this with your agent
- Open in Claude
- Open in ChatGPT
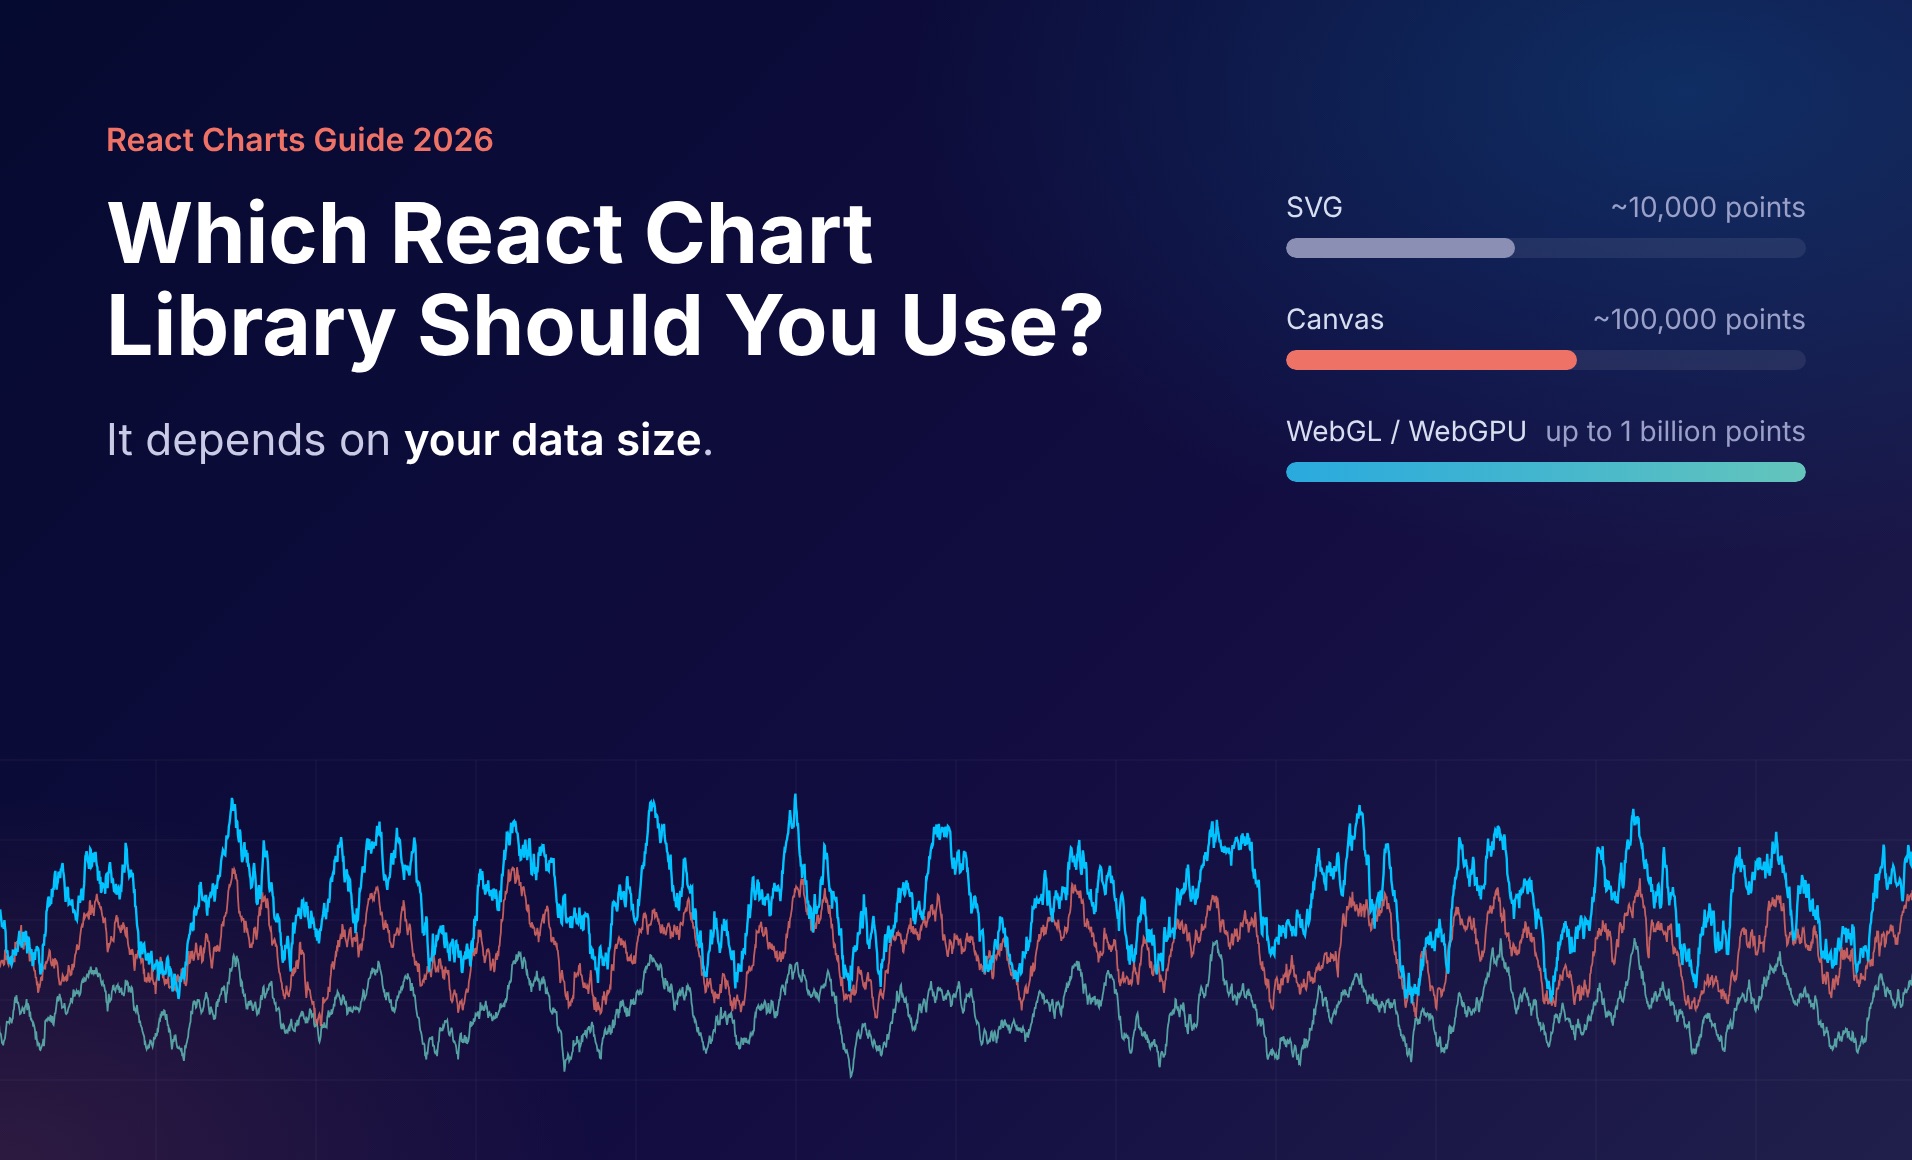
Most "best React chart library" lists rank libraries by popularity. For data-heavy apps, that's the wrong place to start. The question that decides most projects is how many points you need to draw, and how often they change.
Why do React charts slow down with large datasets?
It comes down to the rendering engine:
- SVG creates a DOM element for every point. That's fine for a few thousand points, but performance typically drops somewhere between 10,000 and 50,000.
- Canvas draws pixels instead of DOM nodes and comfortably handles tens of thousands of points. It still runs on the CPU, so sustained high-frequency updates become a bottleneck.
- WebGL and WebGPU render on the GPU. That's where real-time charts with millions of points become practical.
Which React chart library fits which job?
- Small datasets, reports and internal tools (under ~10K points): Recharts, Chart.js
- BI dashboards with many chart types: Apache ECharts, FusionCharts
- Dashboards combining grids and charts: AG Charts
- Same charts on web and React Native: Victory
- Custom visual design at small data sizes: Visx
- Custom visual design at large data sizes: SciChart.js
- Real-time streaming data: SciChart.js
- Millions to billions of data points: SciChart.js
- 3D charts (surfaces, point clouds): SciChart.js
- Financial charts with live indicators: SciChart.js, AG Charts
- Same charting across web (JavaScript, React, Angular, Vue), desktop (WPF) and native mobile (iOS/Android): SciChart
What's the fastest React chart library for real-time data?
For continuous streaming and very large datasets, you need a GPU-accelerated library. SciChart.js renders through WebGL and WebGPU, with WebAssembly handling the data processing. It has shown up to 1 billion data points rendered in the browser, and users can keep panning and zooming while data streams in. Typical use cases include telemetry, order-book and candlestick charts, and 3D scientific visualisation.
Do you have to trade performance for customisation?
Not with SciChart. Its extensible API lets developers build custom chart interactions such as zoom, pan, tooltips and selection through the ChartModifier API. It also supports custom axis layouts, including vertically or horizontally stacked axes, and lets developers override core behaviour for specialist visualisations. A free community licence is available, and commercial licences include support from SciChart's developers alongside an AI assistant.
When should you move from an open-source library to a commercial one?
A practical rule of thumb: once your data regularly exceeds tens of thousands of points, or you need guaranteed response times, test a GPU-based library early. Migrating halfway through a project costs far more than choosing correctly at the start.
How do you choose? Five questions to ask
- How many points will the chart show at once?
- How often does the data update?
- Do users need to zoom and pan while data streams in?
- Do you need 3D, specialist charts or custom behaviour?
- Does the same charting need to work on web, desktop and mobile?
If most of your answers are "a lot", "constantly" and "yes", a GPU-accelerated library will save you a rewrite later.
Read the full comparison of 8 React chart libraries: https://www.scichart.com/blog/best-react-chart-libraries/