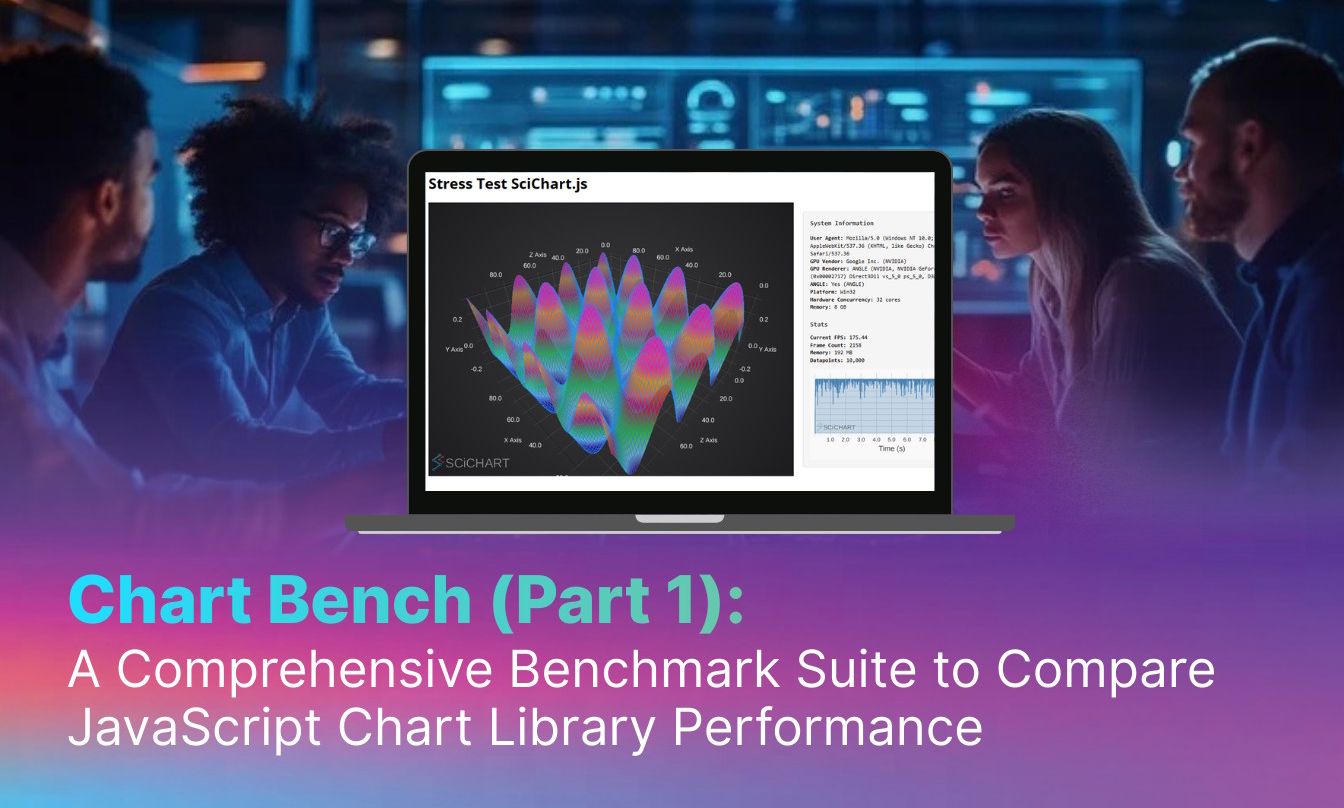
Which JavaScript Chart Library is Fastest? We Benchmarked 8 of Them.
Developers evaluating charting libraries for high-performance applications ask the same question: which one actually holds up under real data loads?
We built an open-source benchmark to find out.
What is Chart Bench?
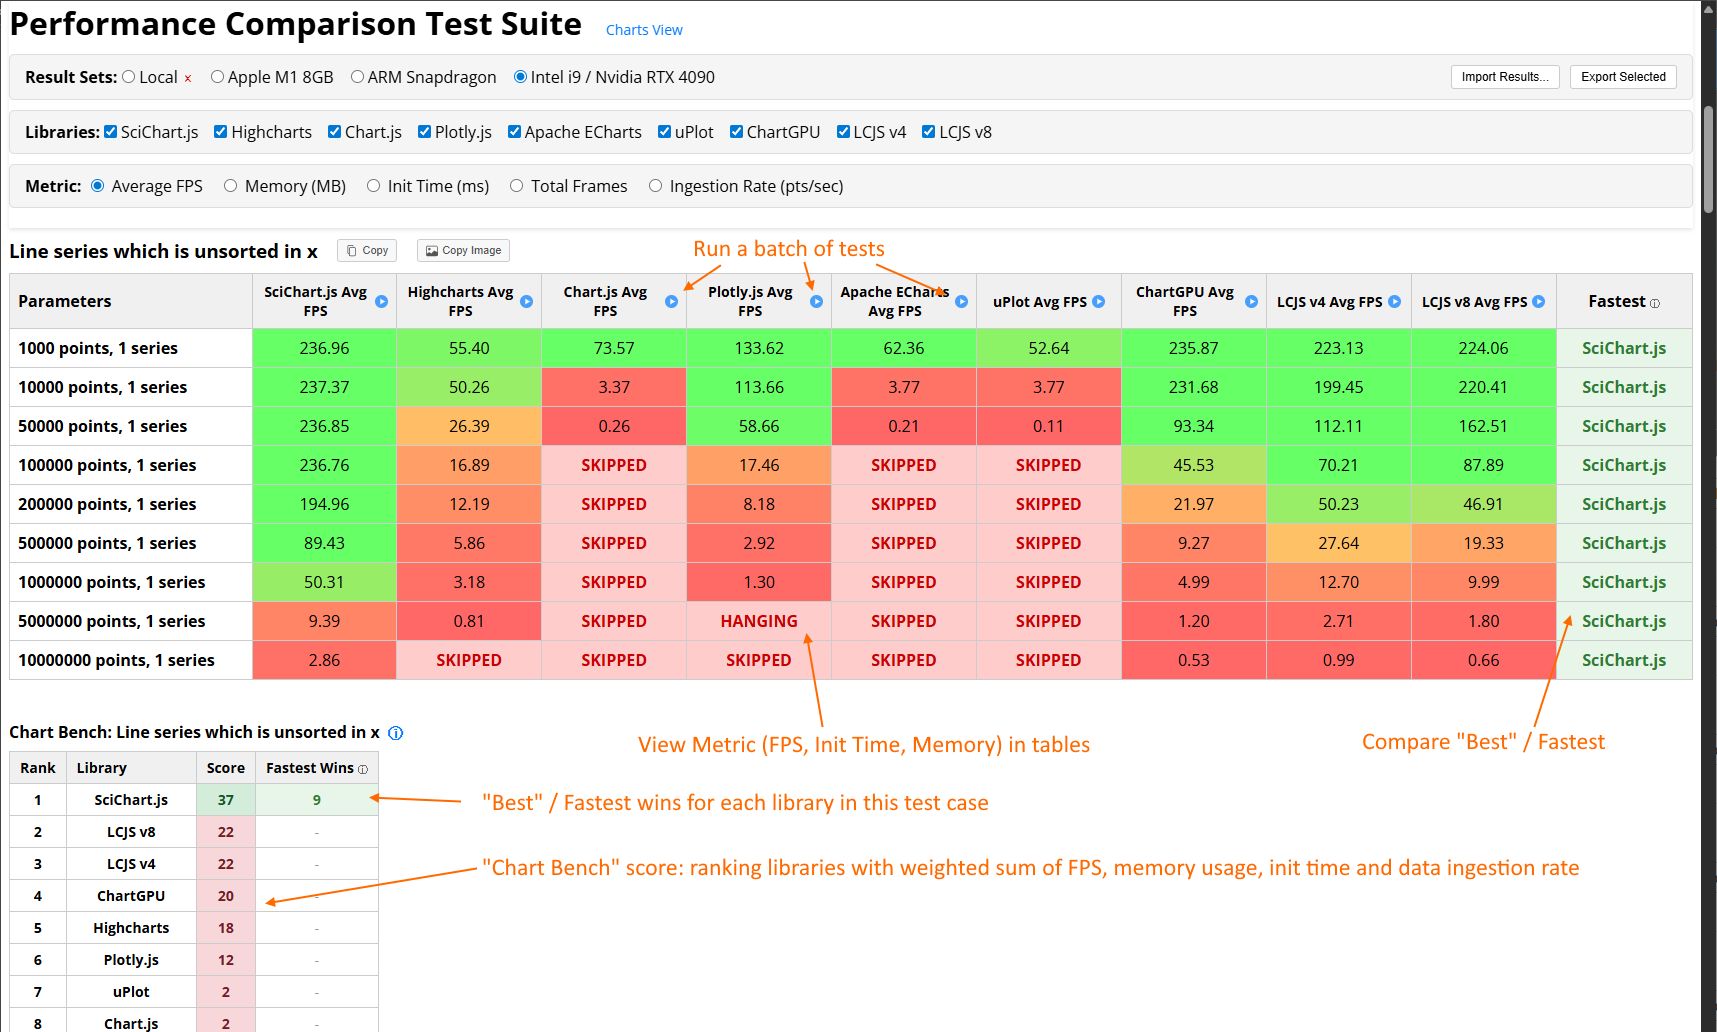
Chart Bench is an open-source JavaScript chart performance benchmark suite that stress-tests popular charting libraries across 13 test cases - including line, scatter, heatmap, candlestick, 3D surface, and multi-chart scenarios.
It measures:
- Frames per second (FPS)
- Time to first render (init time)
- Memory usage
- Data ingestion rate (points/sec)
The benchmark is designed to simulate extreme workloads: millions of data points, real-time streaming, and multiple charts on screen.
It runs locally on your hardware, logs results, and allows JSON export for sharing or comparison.
Clone and run it:
https://github.com/abtsoftware/javascript-chart-performance-test-suite
Libraries Tested
- SciChart.js
- LightningChart.js (v4 + v8)
- Plotly.js
- Highcharts
- Chart.js
- Apache ECharts
- uPlot
- ChartGPU
What It Measures
- FPS under increasing data loads
- Time to first render (ms)
- Memory usage (JS heap)
- Data ingestion rate (points/sec)
- Failure conditions: hangs, freezes, crashes
One Number Worth Knowing
In internal benchmark runs, SciChart.js reached ~40 million data points per second ingestion rate and led in FPS across a majority of tested scenarios on a range of hardware.
Full results - across multiple hardware configurations from high-end GPUs to low-power devices - are published here:
https://www.scichart.com/blog/chart-bench-compare-javascript-chart-libraries/
SciChart is a high-performance charting library for JavaScript, WPF, iOS, and Android, designed for real-time, large-scale data visualisation using GPU-accelerated rendering.
https://www.scichart.com