System Monitoring & Observability Engineer (Prometheus / Grafana)
Role details
Job location
Tech stack
Job description
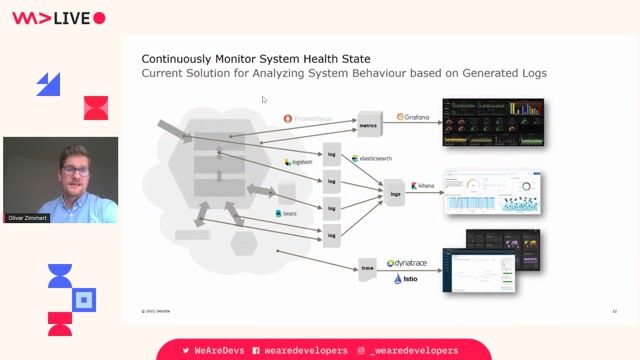
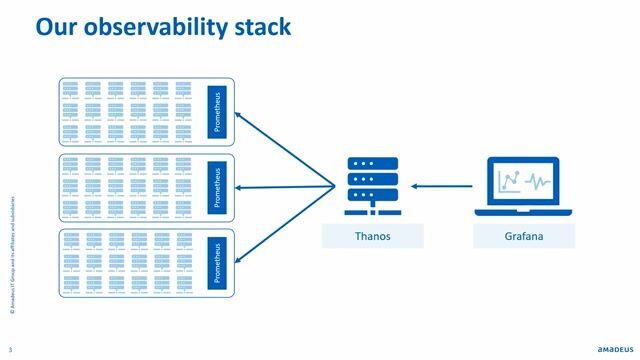
You as a System Monitoring & Observability Engineer (Prometheus / Grafana) here at SRT, you will be part of a small team tasked with implementing an end-user observability visualisation. Currently, we have observability dashboards in place for our engineers, utilising Prometheus for metrics collection and Grafana for visualisation. This initiative aims to deliver a more user-friendly solution tailored for our end-users.
Our clients are located across various countries worldwide, each with differing WAN capabilities, and our system is geographically distributed on-premises across multiple sites. We are fortunate to have a team of highly experiencedengineers, including UX designers, who can provide support and guidance. Our lead observability engineer will oversee and assist with your work throughout the project in the role of System Monitoring & Observability Engineer (Prometheus / Grafana).
Key Responsibilities - System Monitoring & Observability Engineer (Prometheus / Grafana) - (not exhaustive)
- Monitoring & Metrics Collection
- Design, configure, and maintain Prometheus-based monitoring solutions
- Develop and manage metric exporters for application and system-level data
- Optimise Prometheus scraping configurations and retention policies
- Alerting & Incident Response
- Define and maintain alert rules based on SLIs/SLOs and performance baselines
- Ensure alerts are actionable, with minimal false positives
- Participate (not necessarily lead) in on-call rotations and incident postmortems
- Observability Dashboards
- Design and maintain Grafana dashboards for real-time operational insights
- Collaborate with engineering and product teams to create tailored visualisations
- Provide self-service dashboard capabilities for end users
- System Performance & Reliability
- Monitor infrastructure (servers, containers, databases, services) for uptime, latency, and throughput
- Identify bottlenecks and recommend improvements
Requirements
Required Skills & Experience - System Monitoring & Observability Engineer (Prometheus / Grafana)
- Proven experience with Prometheus (including PromQL) and Grafana in production environments
- Strong knowledge of Linux-based systems
- Experience writing and optimising PromQL queries for alerts and dashboards
- Familiarity with exporters (node_exporter, blackbox_exporter, custom exporters)
- Understanding of alertmanager configuration and routing
- Proficiency with Grafana dashboard creation and templating
- Strong troubleshooting skills for infrastructure and application issues
- Familiarity with containers (Docker)
- Scripting skills (Bash, Python, or Go) for automation
Benefits & conditions
- Highly Competitive Salary
- Matched company pension contributions up to 5%
- 25 days annual leave rising to 28 days with service
- Career development opportunities
- Company "Get to know you" days