


Tableau Data Visualization Engineer

Vanderhouwen & Associates, Inc.
Portland, OR, United States
12 days ago

Role details

Contract type
Permanent contract
Employment type
Full-time (> 32 hours)
Experience level
Expert
Experience required
5 years minimum
Working hours
Regular working hours

Tech stack

Agile Methodology Data Analysis Cloud Computing Extract Transform Load (ETL) Data Visualization Design of User Interfaces SQL Databases Tableau (Software) Visual Analytics Information Technology

Job description

Our client is seeking a Tableau Data Visualization Engineer to help transform complex enterprise data into intuitive, impactful analytics that empower business users to make informed decisions. This role partners with cross-functional teams to deliver scalable business intelligence solutions, create engaging visual experiences, and support the adoption of a modern cloud-based analytics environment through high-quality Tableau development and data visualization best practices., * Design, develop, and deploy interactive Tableau dashboards and reports that deliver actionable business insights and support key performance metrics.

  • Partner with business stakeholders, product teams, and data professionals to translate reporting needs into intuitive, user-focused visualization solutions.
  • Develop and maintain Tableau data models by integrating information from multiple enterprise data sources.
  • Utilize SQL to extract, validate, troubleshoot, and prepare data, ensuring the accuracy and reliability of dashboards and visual analytics.
  • Monitor dashboard performance, troubleshoot data refresh and reporting issues, and optimize usability, responsiveness, and overall user experience.
  • Implement role-based security and governance standards to ensure appropriate access to business intelligence assets.
  • Support end users by providing Tableau guidance, documentation, and training to encourage self-service analytics adoption.
  • Participate in Agile development activities while contributing to continuous improvements in reporting processes and visualization standards.

Requirements

  • Bachelor’s degree in Computer Science, Information Technology, or a related technical discipline, or equivalent professional experience.
  • 5+ years of experience designing and developing business intelligence solutions using Tableau.
  • Advanced experience with Tableau Desktop, Tableau Prep, and SQL for data analysis, validation, and reporting.
  • Experience creating interactive dashboards, visual storytelling solutions, and enterprise reporting using multiple data sources.
  • Strong understanding of data modeling, ETL concepts, database management, and business intelligence best practices.
  • Experience supporting BI governance, data quality, and secure role-based access within reporting environments.
  • Familiarity with Agile software development methodologies and collaborative cross-functional project delivery.
  • Experience with cloud-based business intelligence platforms or modern analytics environments is preferred.
  • Knowledge of UI/UX principles for data visualization, SAFe methodologies, or experience within the insurance industry is a plus.

Apply for this position

This job is hosted externally. Click below to view the full posting and apply.

Apply on www.vanderhouwen.com

Good distractions

Talks and stories from around this role — technically off-topic, practically not.

4:49 min

Discovering technical chart requirements via client use cases

Chris Heilmann +3 · LIVE

1:48 min

Automating exploratory data analysis within training pipelines

Dora Petrella · WWC 2023

1:14 min

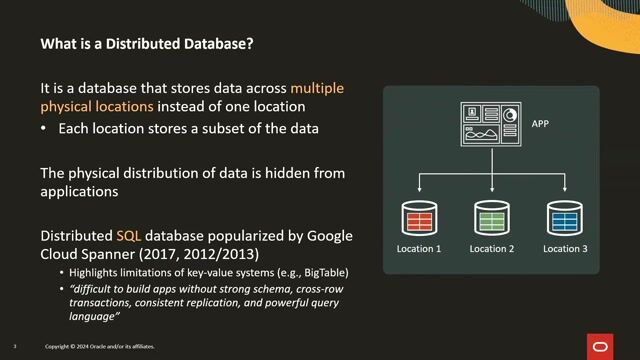
Evolution of distributed SQL database architectures

Wei Hu Wei Hu · WWC 2024

2:27 min

Introduction to WebAssembly in a cloud computing context

Edo Edo · WWC 2024

1:49 min

Selecting backend web frameworks and internal visualization tooling

Kateryna Hrytsaienko · LIVE

1:36 min

Performing exploratory data analysis to uncover underlying patterns

Julian Joseph · LIVE

Videos

See all

Related articles

See all