
SRE / Observability Engineer

Apetan Consulting
Jersey City, United States
9 days ago
Apply on www.dice.com
Prepare application

Role details

Contract type
Temporary contract
Employment type
Full-time (> 32 hours)
Experience level
Experienced
Experience required
3 years minimum
Working hours
Regular working hours
Job source

Tech stack

Microsoft Azure Reliability Engineering Grafana Kubernetes Splunk Serverless Computing

Job description

  • Build monitoring and observability solutions around infrastructure and application environments
  • Create dashboards that provide visibility into:
  • Application health
  • Infrastructure performance
  • Organizational system health
  • Deliver actionable insights and reporting to support operational decision-making
  • Partner with an existing engineer who will be a strong collaborator on the team
  • Help improve reliability, monitoring, and overall operational excellence

Requirements

  • Meraki
  • Kubernetes
  • Azure Functions
  • Azure Containers
  • Grafana
  • Splunk

Desired Mindset & Soft Skills

  • Strong Site Reliability Engineering (SRE) mindset
  • Naturally curious and analytical
  • Comfortable challenging ideas and proposing alternative solutions
  • Able to support recommendations with data and research
  • Willing to bring new perspectives and best practices to the team

Experience Requirements

  • Minimum 3+ years of relevant experience
  • Healthcare industry background strongly preferred
  • Understanding of protecting sensitive patient and personal information
  • Experience working in highly regulated environments is a plus

Apply for this position

This job is hosted externally. Click below to view the full posting and apply.

Apply on www.dice.com
Prepare application

Good distractions

Talks and stories from around this role — technically off-topic, practically not.

2:33 min

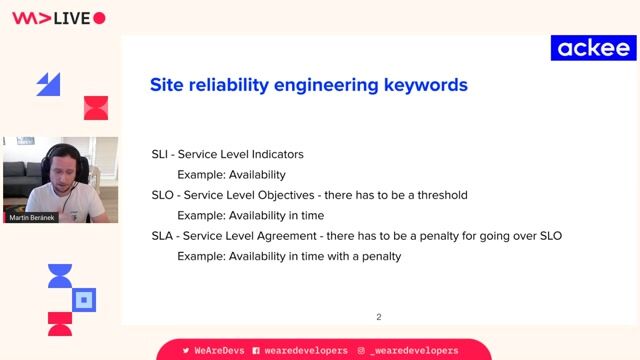
Advocating for SRE practices within agency environments

Martin Beránek · LIVE

2:28 min

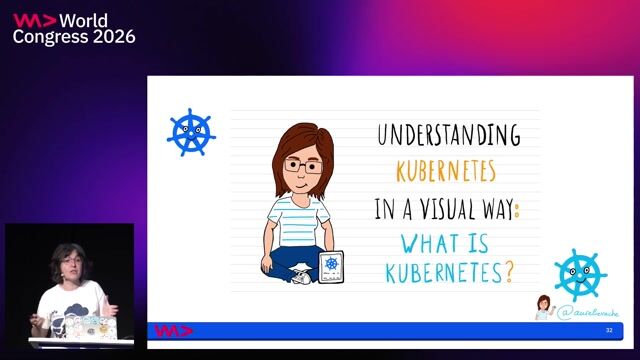
Understanding Kubernetes architecture and core cluster components

Marc Nimmerrichter · World Congress 2022

10:40 min

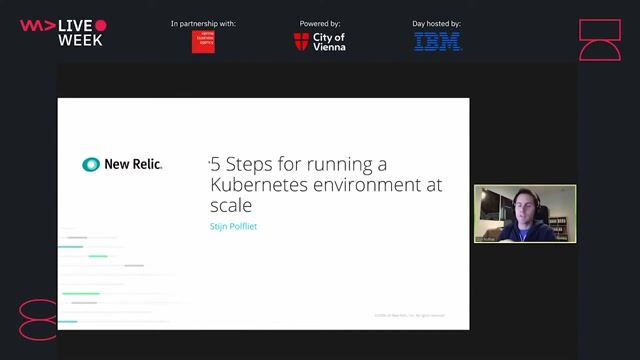
Visualizing Prometheus open metrics using custom Grafana dashboards

Stijn Polfliet · LIVE

2:38 min

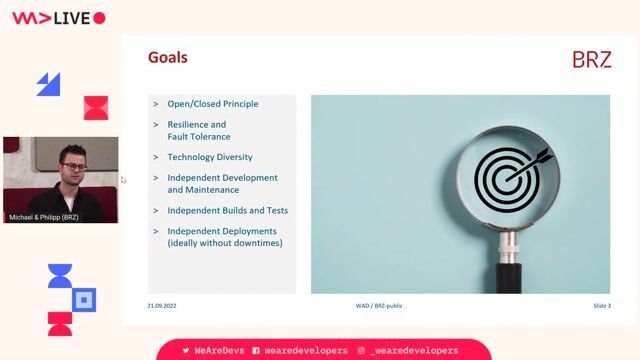
Establishing comprehensive monitoring and log management

Michael Eder +1 · LIVE

4:04 min

Overview of Kubernetes operators and custom resource definitions

Philipp Krenn · World Congress 2022

1:04 min

Visualizing Keycloak performance via standard Grafana troubleshooting dashboards

Alexander Schwartz Alexander Schwartz · World Congress 2025

Videos

See all

Related articles

See all