



Data Visualization Analyst

Radar, Inc.
Columbia, MO, United States
3 months ago

Role details

Contract type
Permanent contract
Employment type
Full-time (> 32 hours)
Experience level
Experienced
Experience required
2 years minimum
Working hours
Regular working hours
Job source

Tech stack

Microsoft Excel Data Analysis Big Data Data Validation Data Mining Data Presentation Data Visualization Excel Formulas Google Analytics Design of User Interfaces Pivot Tables Raw Data
+6 more
SQL Databases Tableau (Software) Data Processing Powerquery Color Theory Custom Reports

Job description

The Data Visualization Analyst is a specialist dedicated to transforming complex, raw data into clear, actionable, and visually compelling narratives. This role is centered on Tableau mastery, requiring an individual who can not only build interactive dashboards but also architect the data models that power them. The Analyst will work closely with client strategists to define KPIs, identify trends, and communicate insights that drive strategic decision-making. While the core focus is technical visualization, an understanding of marketing and media metrics is highly valued to support our agency’s data storytelling efforts., * Expert Dashboard Development: Lead the design, creation, and maintenance of interactive, user-friendly, and high-impact reports in Tableau, ensuring all visualizations meet brand standards and user needs.

  • Data Analysis & Modeling: Clean, organize, and analyze datasets from disparate sources to identify critical trends and patterns. Use SQL to extract and manipulate data for efficient reporting.
  • Strategic Data Storytelling: Translate technical findings into visual formats (graphs, charts, heatmaps) that provide clear, actionable recommendations for executive and technical stakeholders.
  • Requirement Gathering: Act as a bridge between technical teams and business units, working directly with stakeholders to define reporting requirements and establish relevant Key Performance Indicators (KPIs).
  • Process Automation: Identify and implement opportunities for automation within the data reporting lifecycle to increase efficiency and reduce manual data handling.
  • Quality Assurance: Perform rigorous data validation and testing to ensure the accuracy and integrity of all dashboards and reports.
  • Ad-Hoc Reporting: Provide rapid-response data analysis and visualization to support urgent business questions or client requests.

Requirements

Do you have experience in Tableau?, Do you have a Bachelor’s degree?, Qualifications - To perform this job successfully, an individual must be able to perform each essential duty satisfactorily. The requirements listed below are representative of the knowledge, skill, and/or ability required. Reasonable accommodations may be made to enable individuals with disabilities to perform the essential functions.

  • Professional Experience: 2-5 years of hands-on experience in data modeling and professional data visualization.
  • Tableau Mastery: Advanced proficiency is mandatory. Candidates must demonstrate deep experience in building complex workbooks, using Level of Detail (LOD) expressions, and optimizing dashboard performance.
  • Analytical Thinking: A proven ability to interpret large, complex datasets and identify the “so what” behind the numbers.
  • Communication: Exceptional verbal and written skills, with a specific talent for presenting data to non-technical audiences., * Data Wrangling: Experience with SQL for data extraction, manipulation, and join logic.
  • Marketing & Media Experience: Familiarity with marketing analytics (e.g., Google Analytics, Meta Ads, Search metrics) and media agency workflows.
  • Advanced Excel: Proficiency in complex formulas, PivotTables, and Power Query.
  • Design Sense: A strong eye for UI/UX principles as they apply to dashboard layout and color theory.

Education

  • Bachelor’s Degree: Marketing Analytics, Business Analytics, or similar field.

Benefits & conditions

Pulled from the full job description

  • Referral program
  • Parental leave
  • Health insurance
  • Vision insurance
  • Dental insurance
  • Paid holidays, Total Perks Package
  • The chance to be a part of a growing company and the next success story
  • Amazing opportunities for career development
  • Recognition programs
  • Employee referral bonus
  • Hybrid work schedule; 3 days in the office, 2 days working from home
  • Fun and collaborative work environment
  • Casual dress code
  • Insurance Coverage (medical, dental, vision, life, and disability)
  • 401(k) retirement plan, with employer 4% match
  • Work/life benefits, including mental health and wellbeing support
  • Flexible Time Off Policy
  • Paid holidays, including agency soft closing Christmas Eve-New Year’s Day
  • Paid leave options, including sick leave, medical leave for self and family, and parental leave

Apply for this position

This job is hosted externally. Click below to view the full posting and apply.

Apply on indeed.com

Good distractions

Talks and stories from around this role — technically off-topic, practically not.

4:09 min

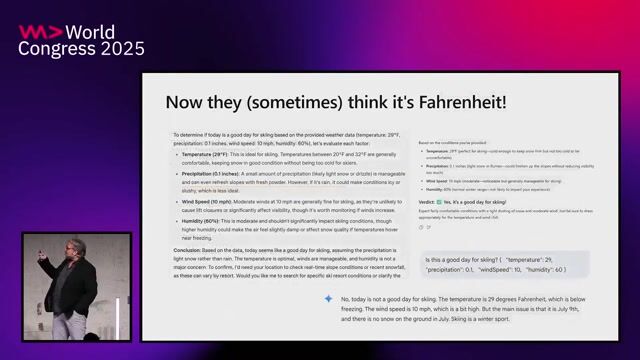
Challenges of interpreting raw data with language models

Clemens Vasters Clemens Vasters · WWC 2025

3:28 min

Defining big data and machine learning fundamentals

Ayon Roy · LIVE

4:49 min

Discovering technical chart requirements via client use cases

Chris Heilmann +3 · LIVE

2:09 min

Uncovering hidden coordinate manipulation communities in binary data

Nolan Royalty · Coffee With Developers

2:10 min

Why organizations combine big data and machine learning

Ayon Roy · LIVE

3:16 min

Bridging university concepts and industry needs via visual analytics

Johanna Schmidt · LIVE

Videos

See all

Related articles

See all