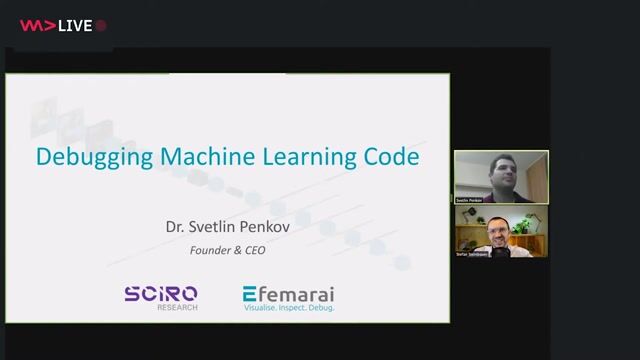
Stop wasting time redesigning models. This talk introduces a visual 3D debugger to find the hidden implementation bugs that traditional tools miss.
#1about 6 minutes
The core challenge of debugging machine learning code
Machine learning models are defined by complex computations on high-dimensional data, making traditional debugging methods ineffective.
#2about 4 minutes
Why you should verify code correctness before redesigning models
Poor model performance is often caused by simple code bugs rather than flawed model architecture, a common oversight in the R&D cycle.
#3about 4 minutes
Distinguishing between semantic and runtime bugs in development
The development process involves two distinct feedback loops for handling semantic bugs from model translation and runtime bugs from data issues.
#4about 9 minutes
Limitations of traditional debugging methods for ML
Standard techniques like printing variables, plotting, and custom dashboards fail to provide insight into the complex, high-dimensional state of modern ML models.
#5about 5 minutes
Introducing FMRI for interactive 3D data visualization
The FMRI debugger allows you to inspect high-dimensional tensors visually in 3D, making it easy to understand complex data structures with a single line of code.
#6about 8 minutes
Visualizing a CNN's computational graph with FMRI scan
By wrapping a training loop with the scan function, FMRI automatically generates an interactive 3D computational graph of a PyTorch model.
#7about 3 minutes
Scaling visual debugging and using automated assertions
FMRI handles large-scale models like VGG19 and includes a library of assertions to automatically detect common issues like vanishing gradients or invalid inputs.
#8about 6 minutes
Live demo of debugging a CNN with FMRI assertions
A live demonstration shows how to inspect a 3D tensor and use FMRI's built-in assertions to instantly find the root cause of NaN errors in a CNN.
#9about 3 minutes
Exploring the full computational graph of ResNet-101
This demonstration visualizes the entire ResNet-101 model, showcasing the tool's ability to handle massive computational graphs and explore learned features.
Related jobs
Jobs that call for the skills explored in this talk.
AI-Powered Debugging: The Future of Fixing Your CodeThe reality of being a developer is that we often spend more time fixing code that actually writing new code.
Debugging is such a core and time-consuming part of software development, it’s no surprise that most developers now use some fomr of artific...
Dev Digest 208: 4 Hours Code a Day, WebMCP Insights, PyTorch for BeginnersInside last week’s Dev Digest 208 .
⏳ You can only code 4 hours per day
📡 How your Bluetooth devices snitch on you
🤖 What to learn about AEO and GEO from OpenAI’s GPT-5 tokeniser
📰 AI agent writing hit pieces on software maintainers
🛡️ OpenClaw thre...