


.gif)
BB
Benedikt Bischof
Making Data Warehouses Fast: A Developer’s Story
about 4 years ago
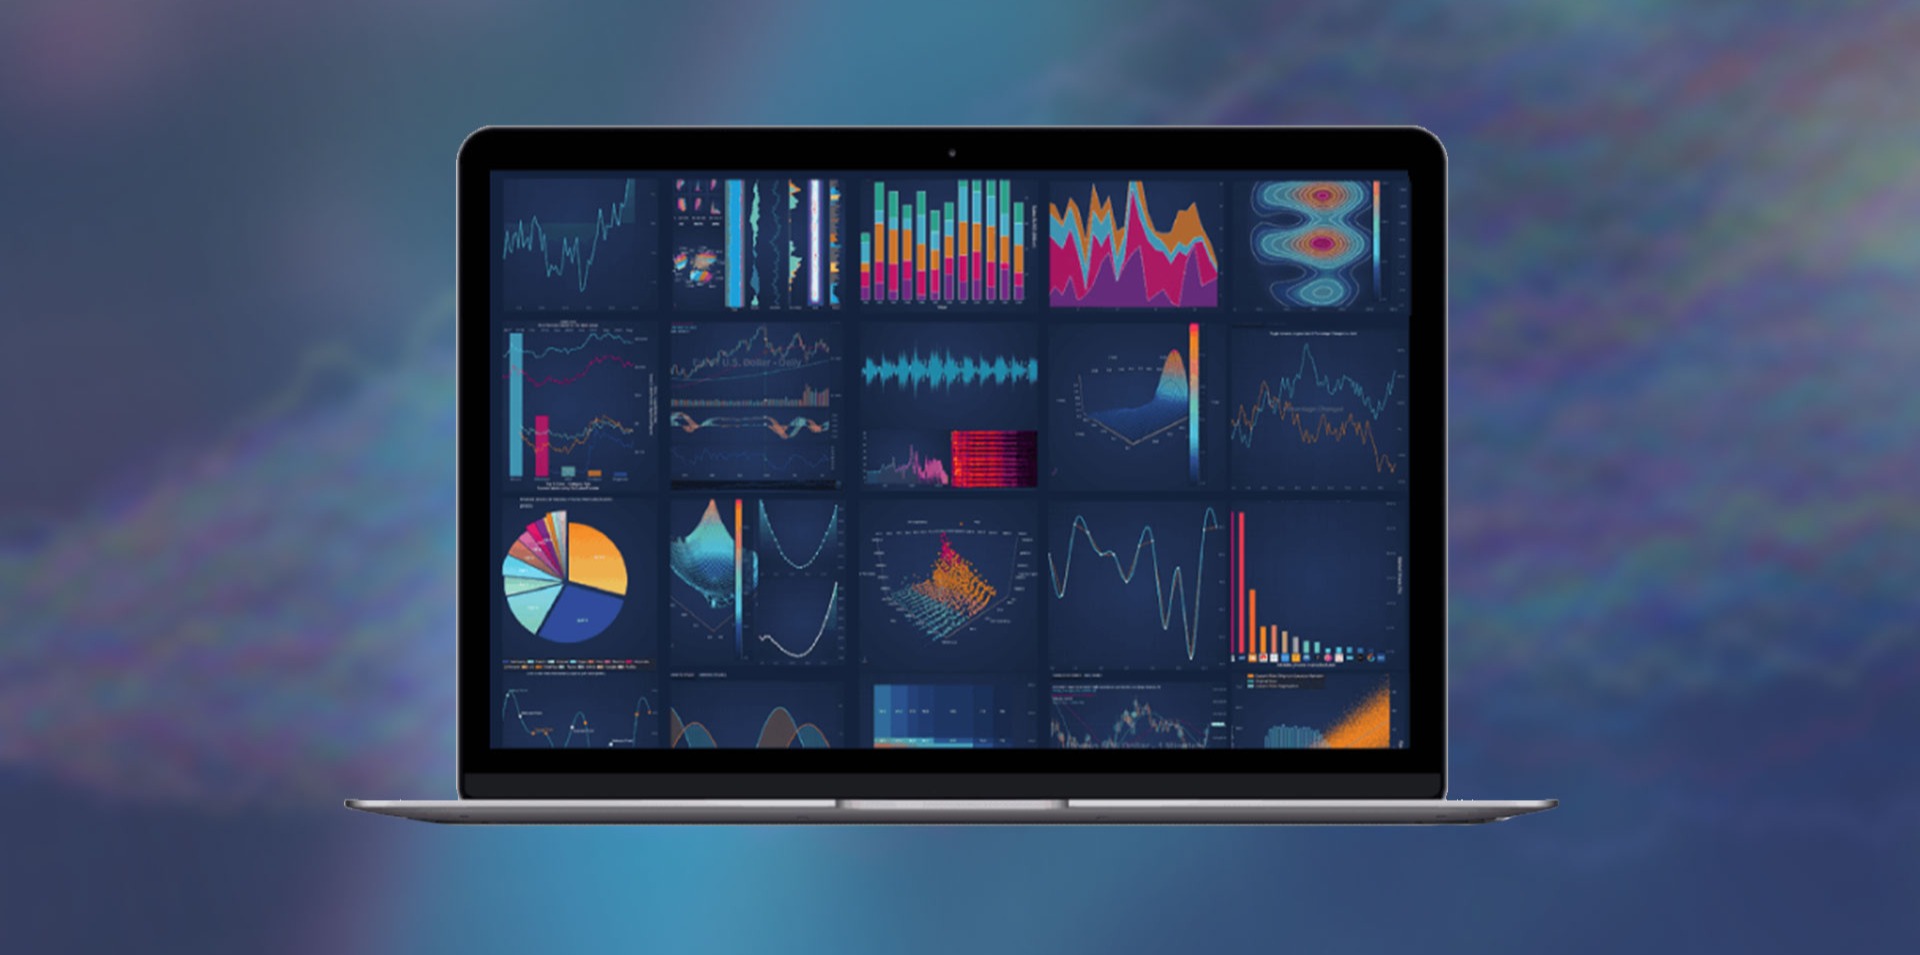
The Dashboard Experience Developer will help design, build, and continuously improve dashboards, reports, widgets, and user-facing data experiences for a centralized performance and analytics repository. This role combines visualization development, user-centered design, and product analysis to create clear, consistent, and actionable reporting experiences for technical, operational, and leadership users.
Working closely with users, product owners, engineers, and analytics teams, this individual will translate reporting needs into intuitive dashboard solutions, refine requirements through user feedback, and help define a consistent design language across reporting and metric experiences. The ideal candidate brings strong dashboard development skills, a user-first design mindset, and the ability to turn complex operational data into simple, modern, and useful experiences.
Additional responsibilities include:
·· Design, develop, and maintain dashboards, reports, widgets, and data visualizations.
· Partner with users and stakeholders to understand needs, workflows, and reporting goals.
· Gather, refine, and document functional, technical, and user experience requirements.
· Translate complex data into clear, actionable, and visually consistent reporting solutions.
· Create wireframes, prototypes, layouts, interaction flows, and dashboard concepts.
· Define and maintain design patterns, standards, and reusable components for reporting experiences.
· Collaborate with engineers to ensure dashboard solutions are feasible, scalable, and implemented accurately.
· Support usability reviews, feedback sessions, and iterative improvements to dashboard designs.
· Ensure reporting experiences are consistent, accessible, intuitive, and easy to navigate.
· Document dashboard logic, metric definitions, design standards, and user guidance.
· Participate in testing, troubleshooting, and validation of reporting solutions.
Contribute to continuous improvement of the overall metric and reporting user experience.
We are a company committed to creating diverse and inclusive environments where people can bring their full, authentic selves to work every day. We are an equal opportunity/affirmative action employer that believes everyone matters. Qualified candidates will receive consideration for employment regardless of their race, color, ethnicity, religion, sex (including pregnancy), sexual orientation, gender identity and expression, marital status, national origin, ancestry, genetic factors, age, disability, protected veteran status, military or uniformed service member status, or any other status or characteristic protected by applicable laws, regulations, and ordinances. If you need assistance and/or a reasonable accommodation due to a disability during the application or recruiting process, please send a request to HR@insightglobal.com.To learn more about how we collect, keep, and process your private information, please review Insight Global’s Workforce Privacy Policy: https://insightglobal.com/workforce-privacy-policy/.
3+ years of experience in dashboard development, data visualization, UX design, or product analysis.
· Experience designing dashboards, reports, widgets, or similar data-driven user experiences.
· Hands-on experience with Grafana, Tableau, Power BI, Superset, or similar visualization tools.
· Strong ability to translate user needs into clear reporting requirements and design solutions.
· Experience creating wireframes, prototypes, mockups, dashboard layouts, or interaction flows.
· Understanding of user-centered design, usability principles, and accessibility considerations.
· Strong visual design judgment, including layout, hierarchy, color, labeling, and consistency.
· Ability to define and document design standards, reusable patterns, and component guidance.
· Working knowledge of SQL and ability to partner with data engineers on dashboard-ready datasets.
· Experience validating dashboard outputs against source data or defined business rules.
· Ability to collaborate with engineers, analysts, product owners, and technical stakeholders.
· Strong analytical, communication, facilitation, and documentation skills. - Familiarity with Agile delivery, backlog refinement, testing, and iterative product development.
This job is hosted externally. Click below to view the full posting and apply.
Talks and stories from around this role — technically off-topic, practically not.
10:40 min
2:07 min
 Oliver Seitz · World Congress 2025
3:28 min
2:22 min
1:04 min
 Alexander Schwartz · World Congress 2025
4:47 min