

World Congress 2022 • Jun 15, 2022

Talk to the Duck - Secrets of the Debugging Masters

Shai Almog

Still relying on static print statements? Master advanced IDE capabilities to rewind execution, log dynamically, and track memory leaks in real time without ever recompiling.

Pause
Mute Enter Fullscreen
#1 about 4 min

Adopting a humble mindset for effective debugging

Viewing debugging as a humbling practice helps developers overcome frustration and ego when finding bugs.

#2 about 2 min

Moving the instruction pointer to re-execute code

Dragging the execution line backward allows developers to retry logic dynamically without restarting the application.

#3 about 2 min

Using trace points for dynamic log generation

Converting regular breakpoints into trace points enables dynamic log evaluation without stopping the program.

#4 about 3 min

Applying wildcard associations to method breakpoints

Using wildcard packages or names enables breaking on multiple related methods simultaneously for comprehensive debugging.

#5 about 2 min

Filtering exception breakpoints to reduce internal stops

Adding class filters for standard libraries prevents the debugger from stopping on internally caught exceptions.

#6 about 2 min

Displaying method return values in the watch area

Enabling return value display ensures method outcomes remain visible in the watch area after stepping out.

#7 about 3 min

Tracking objects dynamically with in-memory object marking

Creating global marker references allows automated comparisons between objects and enables deep virtual machine introspection.

#8 about 2 min

Debugging reactive sequences with the stream debugger

Breaking down functional syntax into columns visualizes exact mappings and transformations in reactive processing steps.

#9 about 5 min

Customizing watch area rendering with code annotations

Defining custom object renderers executes database queries directly within the ui to reveal internal representations seamlessly.

#10 about 2 min

Analyzing object allocation with new instance tracking

Tracking newly instantiated objects between execution steps isolates memory allocations to pinpoint memory leaks efficiently.

#11 about 7 min

Replacing remote debugging with secure developer observability

Injecting dynamic logs and non-breaking snapshots directly into production clusters eliminates the security risks of remote debugging.

Matching moments

4:09 min

Tooling challenges with debugging, logging, and IDEs

Gonzalo Ortiz Jaureguizar Gonzalo Ortiz Jaureguizar · World Congress 2026 Europe

2:04 min

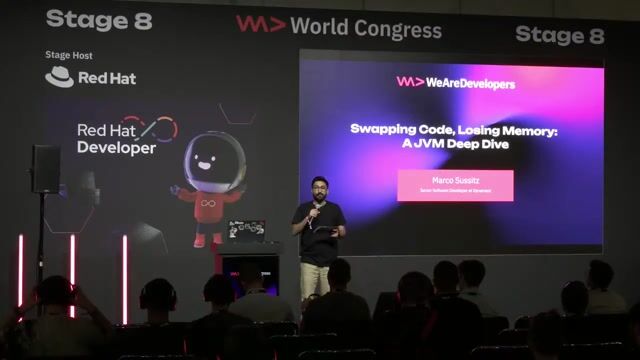
Utilizing the JVM tool interface for dynamic code changes

Marco Sussitz Marco Sussitz · World Congress 2026 Europe

1:28 min

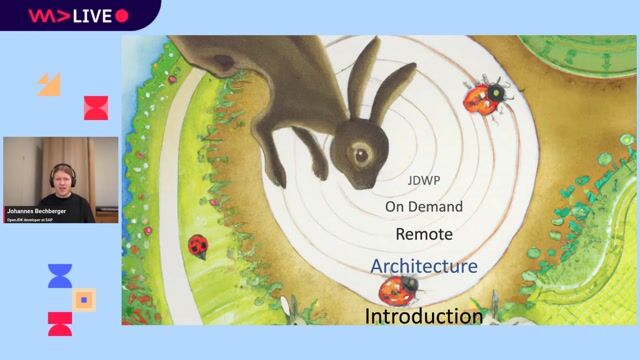
Exploring the high-level Java platform debugging architecture

Johannes Bechberger · LIVE

2:14 min

Compiling and configuring the OpenJDK for direct debugging

Marco Sussitz Marco Sussitz · World Congress 2026 Europe

1:35 min

Cultivating community and powering learning for developers

Jody Bailey Jody Bailey +1 · World Congress 2025

2:11 min

Debugging challenges inside closed source cloud native environments

Gerta Sheganaku +1 · World Congress 2023

Upcoming sessions on this topic

Open session

Teaching AI Coding Agents to Build It Right the First Time

  • Sajeetharan Sinnathurai

    Microsoft

    Principal Product Manager

Open session

How We Cut Our API's p99 Latency from Minutes to Under a Second

  • Deepak Agrawal

    Atlassian

    Principal Software Engineer

Open session

From Profiler to Production: Measuring What Actually Matters in React & React Native

  • Andrei Tazetdinov

    Dynatrace

    React Native Developer

Open session

Autopsy of an Autonomous Incident: When the Agent Made It Worse

  • Navin Pai

    StackGen

    Director of Engineering

Open session

What I Got Wrong Shipping an MCP Server for Live Infrastructure

  • Pritesh Kiri

    Harness

    Developer Relations Engineer

Open session

Beyond File Dumps: Context Engineering for Coding Agents

  • Animesh Dutta

    Arm

    Senior Software Engineer