Business Support Executive - Data Visualisation & Dashboards
Role details
Job location
Tech stack
Job description
The Centre of Excellence (COE) is the driving force behind SmartPA, where strategy comes to life. As part of this dynamic, client-facing department, you'll be the heartbeat of our business - delivering high-impact, tailored support to a key client account daily.
In the role of Business Support Executive, you'll play a pivotal role in providing bespoke solutions to a variety of stakeholders. You'll tackle real challenges, establish meaningful relationships and make a tangible difference to client success.
This particular role is assigned to one of our 'dedicated' clients, meaning you will be representing our brand, whilst working very closely with a global tech giant.
A specialist role for an expert who can transform raw data into clear, actionable, and visually compelling insights.
What Your Day Will Look Like
- Design, build, and maintain interactive data dashboards and reports using tools like Tableau, Power BI, or Looker Studio.
- Work closely with data analysts and business leaders to understand their key performance indicators (KPIs) and reporting needs.
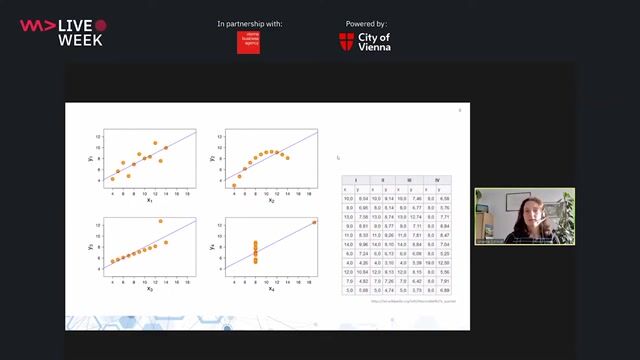
- Apply principles of data visualisation to ensure all charts, graphs, and layouts accurately and effectively communicate the underlying data story.
- Standardise data definitions and reporting metrics to ensure consistency across all business units.
- Conduct data quality checks and troubleshooting on dashboards to ensure accuracy and smooth performance.
- Manage multiple projects simultaneously, maintaining a high level of quality under tight deadlines.
Requirements
Do you have experience in Tableau?, * Expert proficiency in at least one major data visualisation tool (e.g., Tableau, Power BI, Looker Studio).
- Strong understanding of relational databases and experience querying data using SQL.
- A demonstrable portfolio of high-quality dashboards that showcase visual excellence and analytical clarity.
- Excellent communication skills to articulate the story behind the data to a diverse audience.
Desirable:
- Experience with statistical programming languages (e.g., Python, R) for data cleaning/preparation.
- Formal training or a degree in Data Science, Statistics, or a related field.
- Experience with advanced dashboard features like calculated fields, parameters, and complex filters.