


.gif?w=720&auto=compress,format)
Welcome to this issue of the WeAreDevelopers Live Talk series. This article recaps an interesting talk by Sefik Ilkin Serengil who introduced the audience to his application which helped a lot of people during the covid pandemic.
About the speaker:
Miki Lombardi is a full-stack engineer from Florence, Italy. Currently, he is employed at Growens and co-founded the Schrodinger Hat Podcast.
Apart from his love for Python and open source, he also has a weakness for pizza (like a real Italian should).
Recently he spoke at the WeAreDevelopers Live Python Day.
Context of the application
As everyone is surely well-aware: in 2020 the whole world was hit by covid-19. Italy was one of the first European countries that were affected by the virus and Miki explains how everyone in his surroundings didn’t know how to react and just panicked.
Especially in Italy, there was a very high risk of getting infected when waiting in line at the supermarket as, at the beginning of the pandemic, nobody wore a mask or was social distancing. This issue got worse in the days following the global lockdown, as people attacked supermarkets and pharmacies in search of basic goods and necessities. Immediately after the announcement of the lockdown many shops struggled to manage the influx of people, forcing them to gather outside the building and stand in line and wait to be let in. The problem here is that the longer you stay out and in contact with other people, the more likely you are to contract the virus. This is especially true in closed and unventilated environments.
Miki points out that the project he is presenting was created primarily for personal use at first but then became public and used worldwide. It is also a non-profit one as it should help humans to feel and more importantly stay safe. The backend of the code is written in Python and the frontend is mainly in JavaScript.
Here is the link to Miki's project: GitHub - TheJoin95/covid19-market-waiting-times: A project to help people stand in line at the market as little as possible
The idea
After Miki went a couple of times to the grocery store and saw the gatherings of people, managed in lines in front of the malls and pharmacies he began to think for himself about how to track down the amount of waiting people and the time he needed to wait before entering the store. Why not create some sort of tracking based on data, kind of how it works for traffic with Google APIs?
After some more reflection on the idea, Miki had a goal: creating a map with various points of interest such as food, bakers, pharmacies, supermarkets, liquor stores, etc. And on this the waiting times, retrieved by some APIs, should be shown and give the user the possibility to add temporal feedback for the store in which he or she was located.
The most fundamental part of the whole system would be crowdsourcing since API data is based on time, the popularity of the place, and how many devices are nearby. User feedback was therefore crucial.
The map
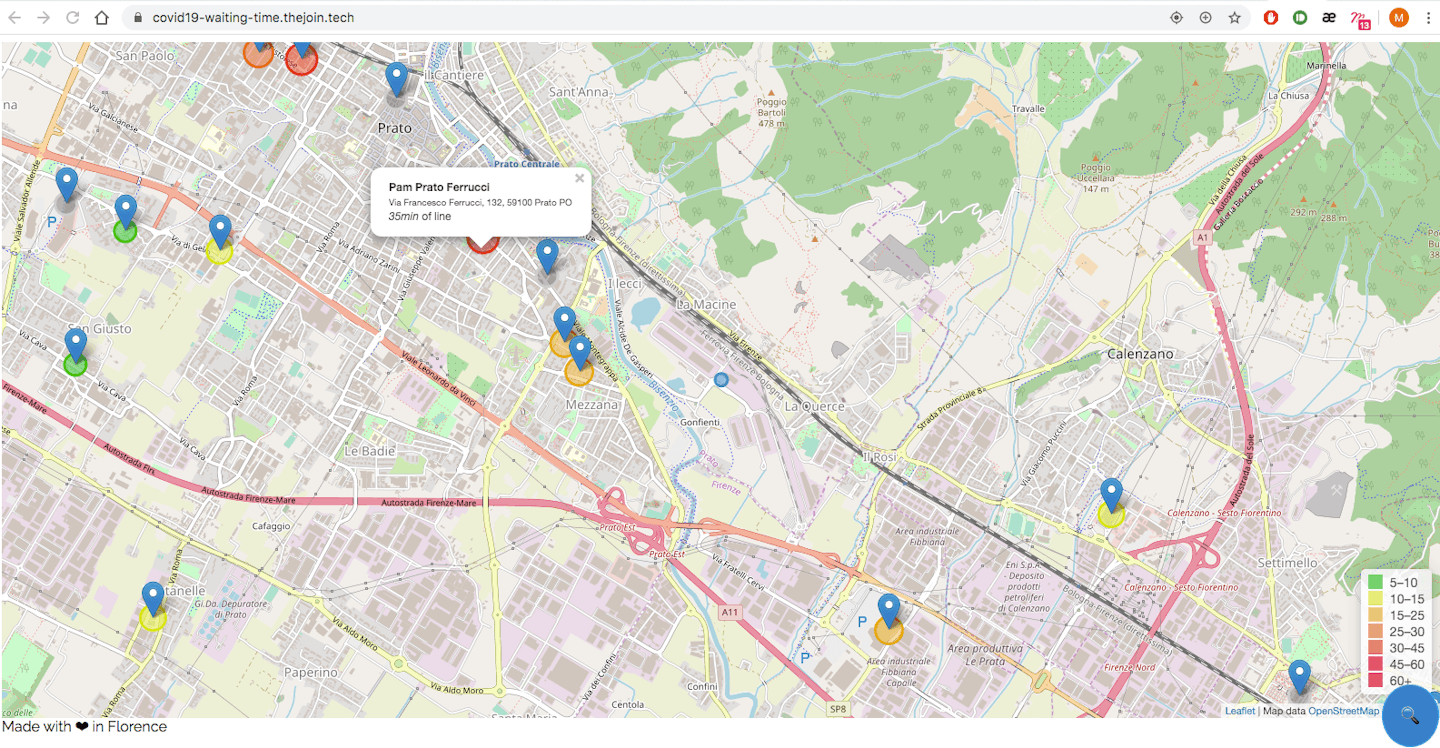
The map worked like the one you would usually find in this kind of application. You can search for an address, a city, or a specific place name. Also, it is possible to leave feedback for spots you have been to so more and more information could be gathered and updated on the map regularly. This system ensures that the next user has access to the right data every time.
In the beginning, when the app was only for personal use for Miki and his friends, the data was limited to Florence. But after it went public much more was gathered, and the map became more and more useful to everyone.
Technology
Code-wise Miki used Python, uWSGI, and Nginx for the backend part. Flask and Redis also came in handy. Meanwhile, the frontend is a plain JavaScript application.
Everything is hosted on a Raspberry Pi 3B Modell with 1GB+32GB. Miki used the port forwarding and dynamic DNS for personal use and for a better way of testing with his friends. Although the load average was always very high the system maintained a good performance throughout the beta testing. This went on for about a month and his beta testers were his friends, mother, grandmother, some friends of friends, and a local priest.
Going Worldwide
After the testing, Miki decided to go public. For this, he chose a cloud environment, more specifically the virtual private server from OVH.cloud. Although this was the cheapest server, he could find it hast 2GB RAM with 30GB Storage and a dual-core CPU. He also used 3 VPS from Digital Ocean for the regions with more traffic (New York, San Francisco, and the UK).
Why did he decide to go with cloud? First of all the Raspberry is great for managing a couple of users, but for going public the system was simply too weak as it didn’t manage to maintain a good performance after 40 contemporary users and the app had more than 100 at this time.
Miki also moved the frontend side on Netlify with JamStack. This helped him with maintaining a good performance. As he had more than 20k page views per day this was a necessity for preventing the system to crash because of the bigger loads. The most page views per day recorded were about 100k.
APIs
The different endpoints and their usage are as follows:
/geocode -> get geocoding data based on Here and Google API
/places/get-waiting-times -> get the estimated waiting time for a place id
/places/get-by-name -> get the place by its name
/places/explore -> get the place by geocoding
/feedback -> crowdsourcing logic via feedback
/logger -> logging data such as trace error, message infos
The multithreading was managed via uWSGI which improved performance by a lot at the API layer.
Geospatial in Redis
Miki points out, that Redis really saved this project because it’s a good database according to him.
Here is a code snippet:
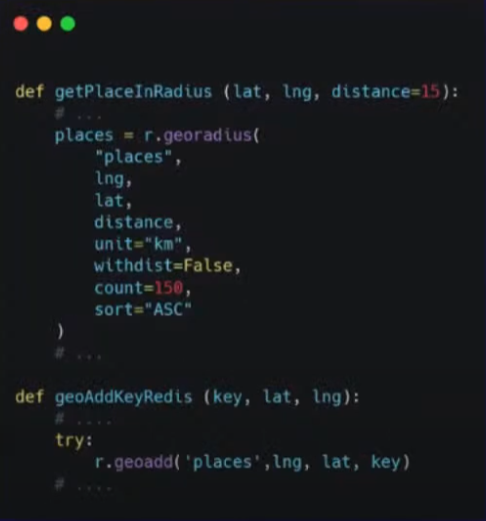
In order to get the places with their specific wait times, Miki added the place in a Redis DB via GEOADD.
By retrieving the information per latitude and longitude he used GEORADIUS.
Having the information saved and encoded geographically is a really good advantage in terms of performance according to Miki.
And on every request, he wrote on Redis DB with a TTL.
Costs: from RBPi to Cloud
For the Raspberry Pi 3B Model Miki paid around 30$ back in 2020. As a domain, he reused his existing one thejoin.tech, and just created a subdomain covid-waiting-time.
Hosting the project on the cloud cost him about 25$ per month. So, in the three months of usage (from April to June 2020), Miki spent 75$ for OVH and Digital Ocean. And since the free inbound/outbound traffic was 10GB per month this wasn’t an issue as the frontend is only a few KB big.
In the end, also having the frontend in the cloud allowed Miki to reach more than 1 million users in 2.1 million sessions around the 3-month life cycle with more than 1.5K contemporary users.
Thanks
Miki points out, that he is really pleased to have the chance to help people all over the world with his project. Also, he wants to give thanks to the open-source as he used a lot of libraries that helped him out a lot. Daniel Dafoe also gets a shout-out for doing the WebIAM and Design.
Thank you for reading this article. If you are interested in hearing Miki himself you can do so by following this link: Free Developer Talks & Coding Tutorials | WeAreDevelopers.