Alexander Schwartz
Keycloak case study: Making users happy with service level indicators and observability
#1about 2 minutes
The critical role of single sign-on systems
Single sign-on systems are a critical dependency for all enterprise applications and users, requiring high availability and performance, especially during usage spikes.
#2about 3 minutes
An overview of Keycloak for identity management
Keycloak is a mature, fully open-source CNCF incubating project for identity and access management that handles authentication, user registration, and more.
#3about 5 minutes
Measuring user happiness with service level objectives
User happiness can be quantified by measuring key metrics like availability, error rate, and latency against defined service level objectives (SLOs).
#4about 2 minutes
Measuring availability and error rates with Prometheus
Prometheus can measure service availability using its built-in 'up' metric and calculate error rates by analyzing HTTP request status codes with PromQL.
#5about 2 minutes
Using Prometheus histograms to measure request latency
Enabling histograms for metrics allows you to categorize requests into performance buckets, making it possible to measure latency against specific SLOs.
#6about 1 minute
Visualizing key metrics with the Keycloak dashboard
Keycloak provides a pre-built Grafana dashboard to visualize availability, error rates, and response times for at-a-glance monitoring of service health.
#7about 4 minutes
Finding root causes with distributed tracing
Distributed tracing with OpenTelemetry provides detailed, request-level insights into performance bottlenecks and errors that high-level metrics cannot reveal.
#8about 2 minutes
How Keycloak adds business context to traces
Keycloak enhances traces by adding business-specific information like client ID, realm name, and user session to simplify searching and debugging.
#9about 2 minutes
Connecting metrics to traces using exemplars
Exemplars link specific traces to your metrics, allowing you to jump directly from a slow request in a histogram to its detailed trace for analysis.
#10about 2 minutes
Using exemplars in Grafana for targeted analysis
Heatmaps in Grafana with exemplars enabled allow you to click on an outlier data point and immediately investigate the corresponding trace for that request.
#11about 3 minutes
Using observability for better business outcomes
A robust observability strategy helps track user-centric metrics, chase tail latencies, and make data-driven decisions about infrastructure and feature development.
Related jobs
Jobs that call for the skills explored in this talk.
IGEL Technology GmbH
Bremen, Germany
Senior
Java
IT Security
Eltemate
Amsterdam, Netherlands
Intermediate
Senior
TypeScript
Continuous Integration
+1
Matching moments
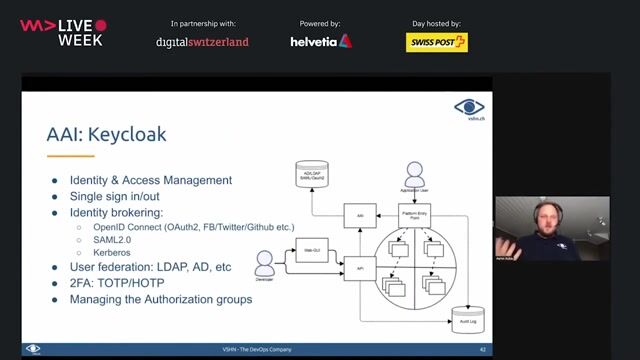
02:04 MIN
Centralizing security services in a Kubernetes ecosystem
DevSecOps: Security in DevOps
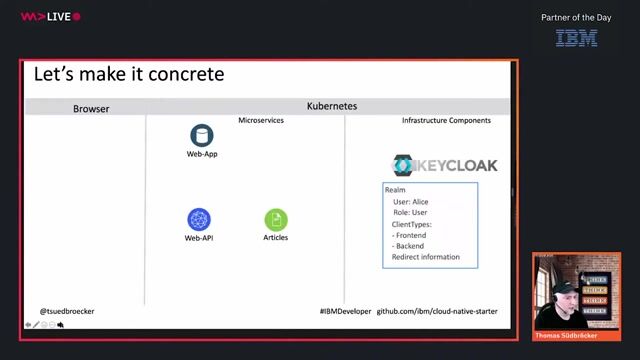
11:43 MIN
Implementing the authentication and authorization workflow
Get started with securing your cloud-native Java microservices applications
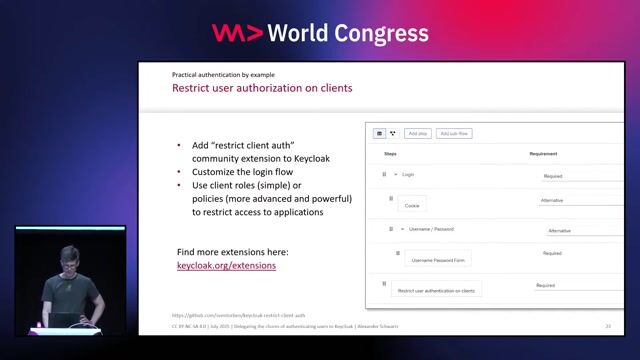
03:12 MIN
Customizing login flows and exploring further capabilities
Delegating the chores of authenticating users to Keycloak
04:50 MIN
Q&A on monitoring, security, and monorepos
Get ready for operations by pull requests
02:10 MIN
Introducing the key players in an OIDC ecosystem
Delegating the chores of authenticating users to Keycloak
06:48 MIN
Choosing an open source stack for security
Get started with securing your cloud-native Java microservices applications

01:08 MIN
Introducing Keymate for zero-rewrite authorization on Keycloak
Keymate – Modern Authorization for Developers
01:59 MIN
Configuring user profiles for incremental data collection
Delegating the chores of authenticating users to Keycloak
Featured Partners
Related Videos
 23:42
23:42Delegating the chores of authenticating users to Keycloak
Alexander Schwartz
 06:04
06:04Keymate – Modern Authorization for Developers
Halil Özkan
 1:48:32
Get started with securing your cloud-native Java microservices applications
Thomas Südbröcker
 27:55
27:55Going Beyond Passwords: The Future of User Authentication
Gift Egwuenu
 49:52
49:52Accelerating Authentication Architecture: Taking Passwordless to the Next Level
Yedidya Schwartz
 29:31
29:31Break the Chain: Decentralized solutions for today’s Web2.0 privacy problems
Adam Larter
 1:00:00
Un-complicate authorization maintenance
Alex Olivier
 31:02
31:02Supercharge Agentic AI Apps: A DevEx-Driven Approach to Cloud-Native Scaffolding
Daniel Oh
Related Articles
View all articles


From learning to earning
Jobs that call for the skills explored in this talk.

init AG
Berlin, Germany
Senior
Java
Spring
Continuous Integration

init AG
Köln, Germany
Senior
Java
Spring
Continuous Integration

init AG
Mainz, Germany
Senior
Java
Spring
Continuous Integration

init AG
Leipzig, Germany
Senior
Java
Spring
Continuous Integration


Grafana Labs
Remote
€97-116K
Senior
Go
React
Grafana
+2

glueckkanja AG
Azure
Powershell
Microsoft Access
Microsoft Active Directory
Scripting (Bash/Python/Go/Ruby)

init AG
Hamburg, Germany
Senior
Java
Spring
Continuous Integration

Grafana Labs
Remote
£91-110K
Senior
Go
React
Grafana
+2